HOT TOPICS LIST
- MACD
- Fibonacci
- RSI
- Gann
- ADXR
- Stochastics
- Volume
- Triangles
- Futures
- Cycles
- Volatility
- ZIGZAG
- MESA
- Retracement
- Aroon
INDICATORS LIST
LIST OF TOPICS
PRINT THIS ARTICLE
by Koos van der Merwe
The Cooper Companies' (COO) financials come in mixed for Quarter 2; beating on a share basis but shy on revenue.
Position: Accumulate
Koos van der Merwe
Has been a technical analyst since 1969, and has worked as a futures and options trader with First Financial Futures in Johannesburg, South Africa.
PRINT THIS ARTICLE
ENVELOPES
The Cooper Companies, Inc.
06/10/13 04:34:39 PMby Koos van der Merwe
The Cooper Companies' (COO) financials come in mixed for Quarter 2; beating on a share basis but shy on revenue.
Position: Accumulate
| The Cooper Companies, Inc. performed well in the surgical and ophthalmic market. The company is the third largest manufacturer of contact lenses in the world. On the surgical side, Cooper Surgical focuses on women's health care focused on in-vitro fertilization. In July of 2012, the company purchased Origio, a company headquartered out of Denmark, a leading in-vitro fertilization company. This has improved gross margins, reduced their debt, and increased acquisitions. What do the charts say? |

|
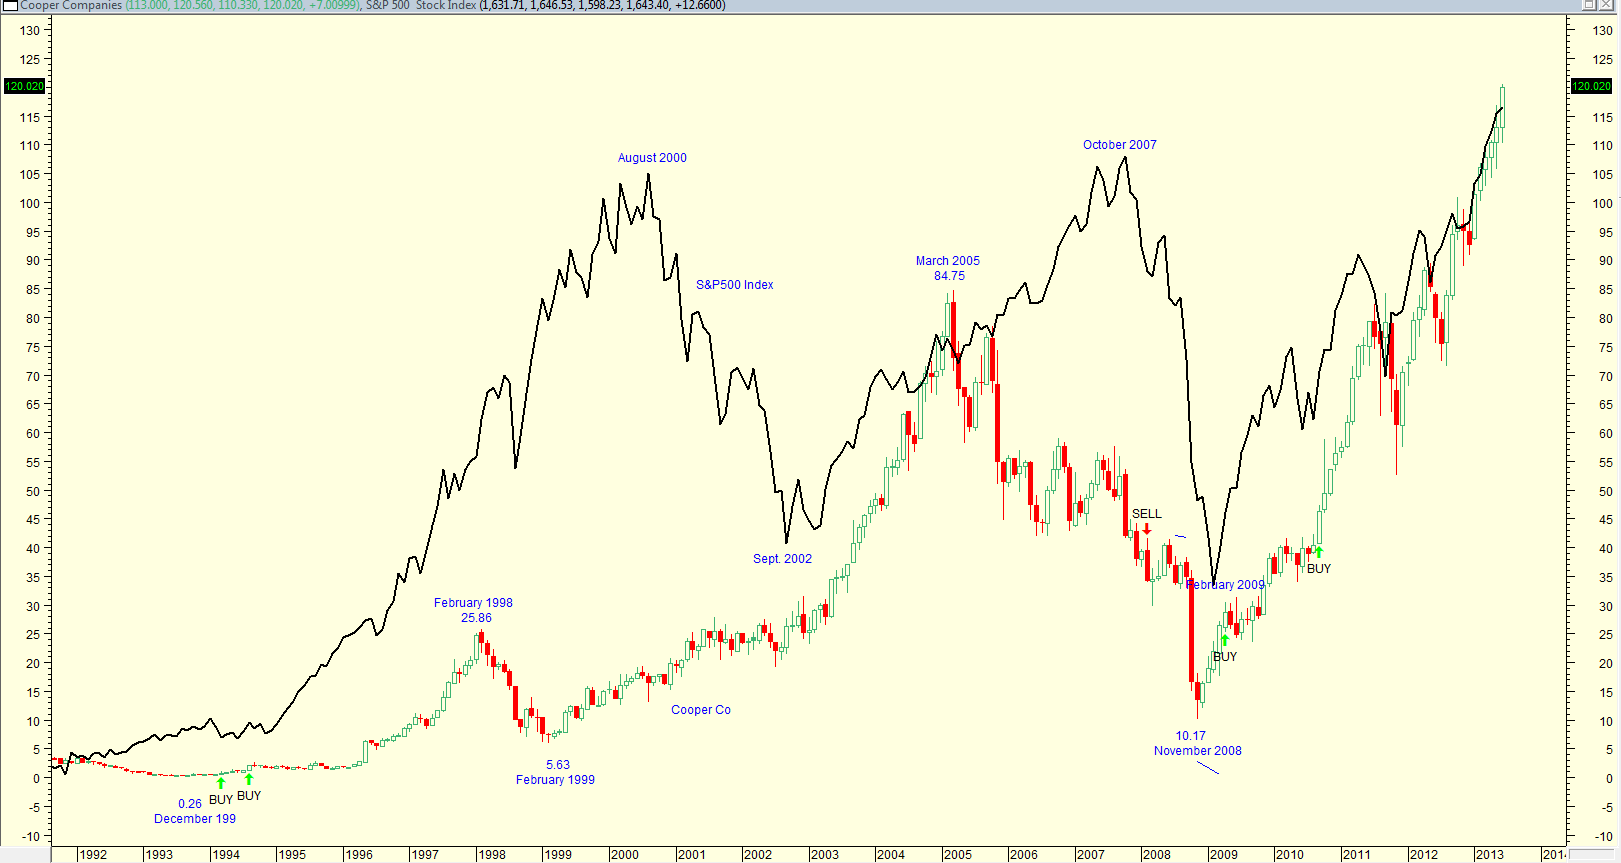
| Figure 1. Monthly chart of Cooper Co with S&P500 Index. |
| Graphic provided by: MetaStock. |
| |
| The monthly chart in Figure 1 of the the S&P 500 index shows how the share price started life at 26 cents in December 1993 and after a slow start, topped out at $25.86 in February 1998 before falling ahead of the technology bubble burst of August 2000, to a low of $5.63 by February 1999 as the S&P500 index rose. The share price started recovering ignoring the collapse in the S&P500 index reaching a high of $84.75 by March 2005. The mortgage backed security bubble burst in October 2007 but the share price of COO was already falling and bottomed at $10.17 in November 2008. The S&P500 index only started recovering in February 2009. The chart shows how the share price moved in sync with the index to date. |

|
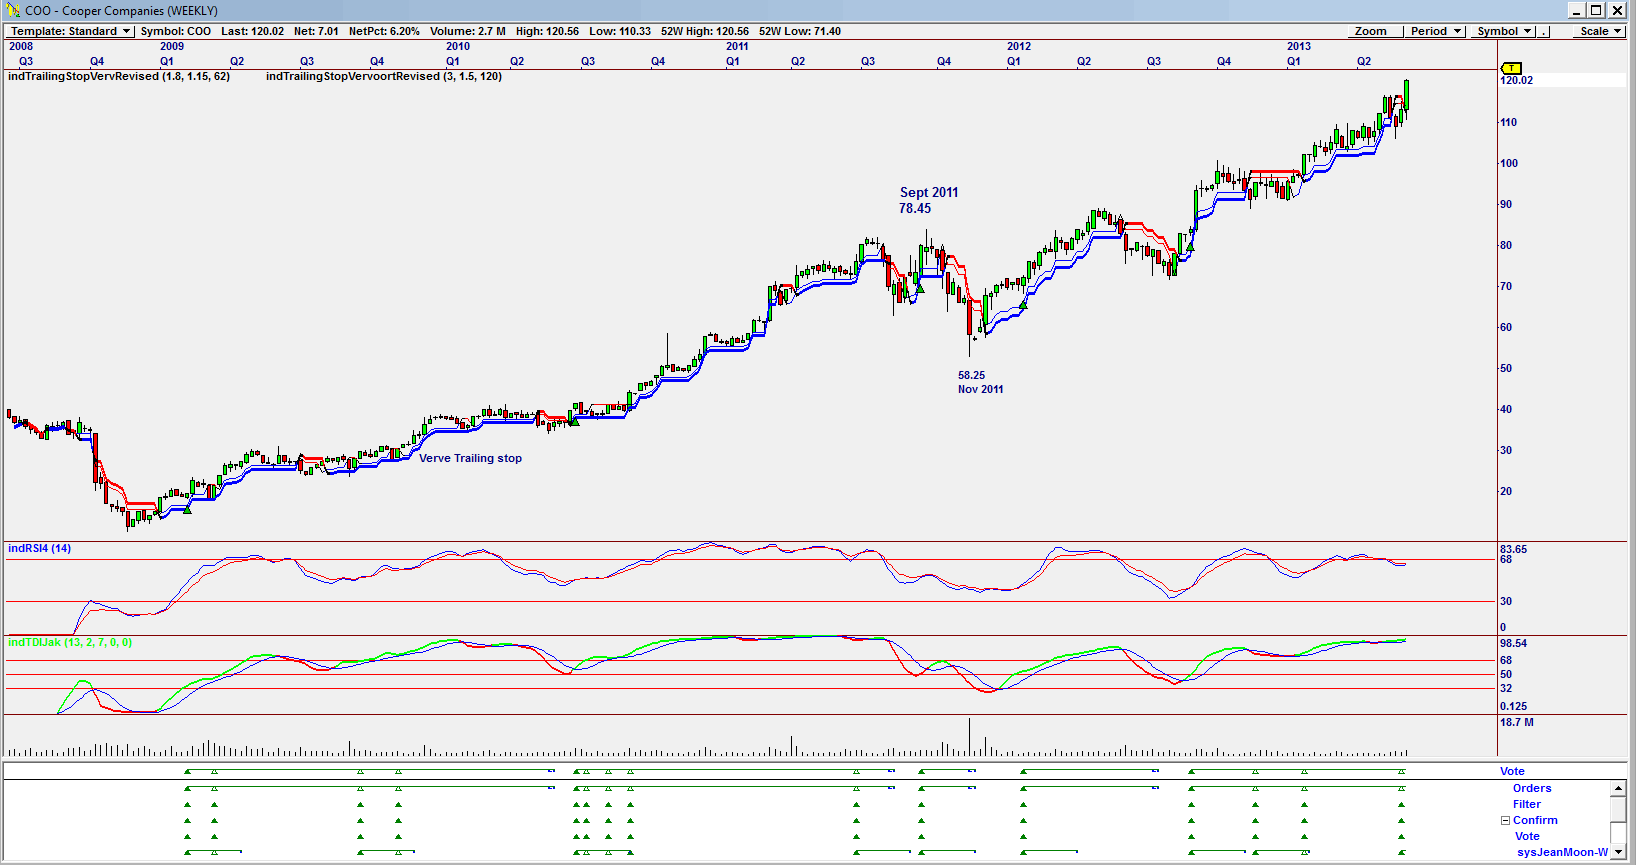
| Figure 2. Weekly chart showing strategy buy signals. |
| Graphic provided by: Omnitrader. |
| |
| The chart in Figure 2 is a weekly chart and shows how the price moved up from a low of $13.40 in November 2008 to a high of $78.45 by September 2011, correcting to $58.25 by November 2011 before rising to its present high of $120.02. Note the vote line on the chart which shows the buy and stop signals given by the JM internal band strategy. The verve trailing stop would have suggested a sell in many cases ahead of the JM internal band stop signal. The two indicators on the chart, the RSI(14) and the TDI are both in overbought positions suggesting a possible correction. |

|
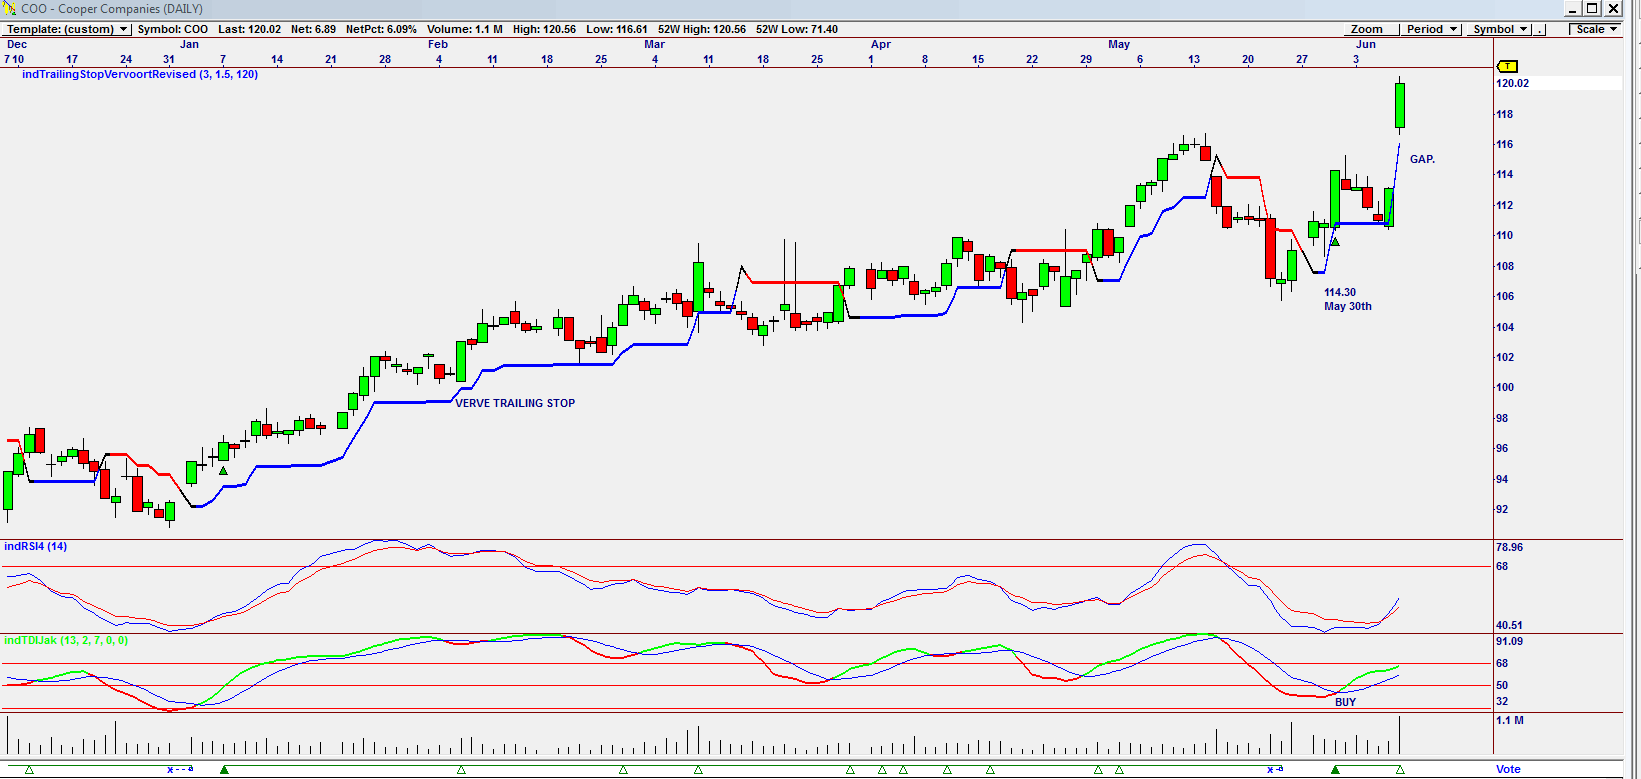
| Figure 3. Daily chart showing buy signal given on May 30, 2013. |
| Graphic provided by: Omnitrader. |
| |
| The daily chart in Figure 3 shows a JM internal band strategy giving a buy signal on the vote line on May 30, 2013, when the price was $114.30. The TDI indicator gave a buy signal on that date as the share price rose strongly. The share price then fell finding support on the Verve trailing stop before rising strongly over the past two days with the rise on Friday June 7, 2013, creating a gap. The JM Internal Band strategy reaffirmed a buy signal on June 7, 2013, but with the rule, "a stock price falls to fill the gap" on my mind, I would now wait for a correction before buying the stock. COO is a company that has moved very strongly and does not appear to follow the trend of the S&P500 index. It seems to follow its own set of rules. This is a company I would like to own, and shall buy it on a correction. |
Has been a technical analyst since 1969, and has worked as a futures and options trader with First Financial Futures in Johannesburg, South Africa.
| Address: | 3256 West 24th Ave |
| Vancouver, BC | |
| Phone # for sales: | 6042634214 |
| E-mail address: | petroosp@gmail.com |
Click here for more information about our publications!
PRINT THIS ARTICLE

Request Information From Our Sponsors
- StockCharts.com, Inc.
- Candle Patterns
- Candlestick Charting Explained
- Intermarket Technical Analysis
- John Murphy on Chart Analysis
- John Murphy's Chart Pattern Recognition
- John Murphy's Market Message
- MurphyExplainsMarketAnalysis-Intermarket Analysis
- MurphyExplainsMarketAnalysis-Visual Analysis
- StockCharts.com
- Technical Analysis of the Financial Markets
- The Visual Investor
- VectorVest, Inc.
- Executive Premier Workshop
- One-Day Options Course
- OptionsPro
- Retirement Income Workshop
- Sure-Fire Trading Systems (VectorVest, Inc.)
- Trading as a Business Workshop
- VectorVest 7 EOD
- VectorVest 7 RealTime/IntraDay
- VectorVest AutoTester
- VectorVest Educational Services
- VectorVest OnLine
- VectorVest Options Analyzer
- VectorVest ProGraphics v6.0
- VectorVest ProTrader 7
- VectorVest RealTime Derby Tool
- VectorVest Simulator
- VectorVest Variator
- VectorVest Watchdog
