

HOT TOPICS LIST
- MACD
- Fibonacci
- RSI
- Gann
- ADXR
- Stochastics
- Volume
- Triangles
- Futures
- Cycles
- Volatility
- ZIGZAG
- MESA
- Retracement
- Aroon
INDICATORS LIST
LIST OF TOPICS
PRINT THIS ARTICLE
by Donald W. Pendergast, Jr.
Having recently breached the downside of a three month old trading range pattern, shares of Discovery Communications appear to be setting up for yet another leg down.
Position: N/A
Donald W. Pendergast, Jr.
Freelance financial markets writer and online publisher of the Trendzetterz.com S&P 500 Weekly Forecast service.
PRINT THIS ARTICLE
KELTNER CHANNELS
DISCA: Breakdown From Three-Month Consolidation
06/07/13 03:53:32 PMby Donald W. Pendergast, Jr.
Having recently breached the downside of a three month old trading range pattern, shares of Discovery Communications appear to be setting up for yet another leg down.
Position: N/A
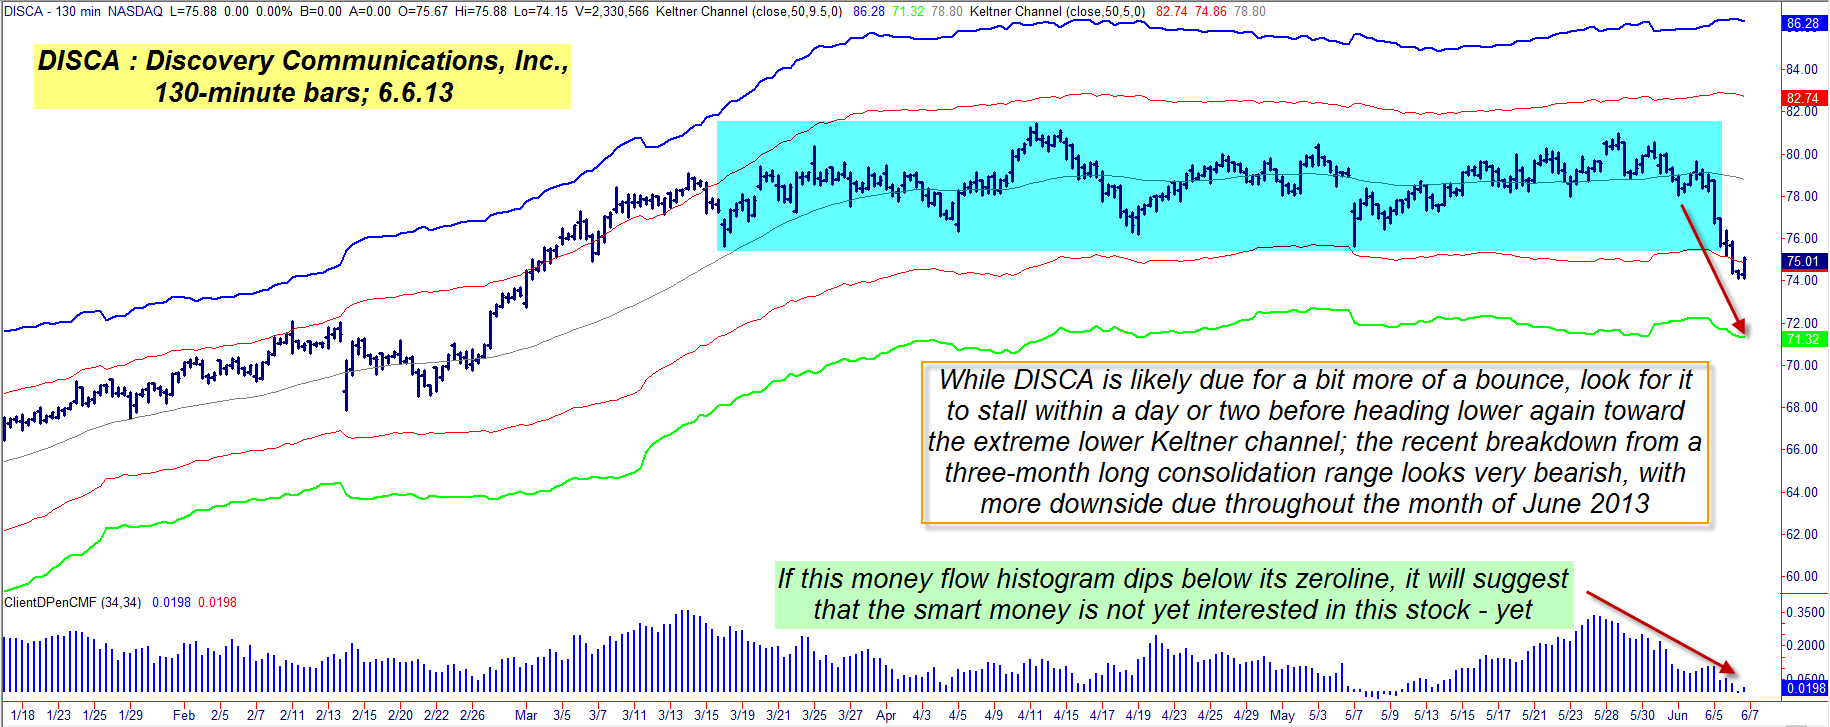
| In the style of many other "boring" large cap stocks, shares of Discovery Communications (DISCA) tend to spend about 90% of their time trading between the two innermost Keltner channels – especially on this 130-minute timeframe bar chart – and when the stock makes a solid push beyond these two bands (set at five times the stock's 50-period average true range, or ATR, for this timeframe), it pays to do some extra homework to see if the developing move is worthy of a trade entry. In this particular case, it does appear that DISCA's line of least resistance is toward lower valuations for at least the next few weeks; here's a closer look (Figure 1). |
|
| Figure 1. DISCA's breakdown out of a well defined trading range pattern could lead to even more downside in the next 7 to 10 trading sessions; key support levels are near 71.00 and then 69.00, respectively. |
| Graphic provided by: TradeStation. |
| |
| The large consolidation range pattern (blue shaded area) is the most striking feature on DISCA's 130-minute timeframe chart; the stock managed to remain within a well-defined $6-wide range for a full three months until it plunged southward just a couple of trading sessions ago. With the medium term Chaikin Money flow histogram (CMF)(34) falling off rapidly during the past two weeks, there is no sign at all that the "smart money" folks (big institutions like mutual funds, etc.) are interested in stopping DISCA's slide just yet; notice also that the lower of the innermost Keltner (red line) is sloping lower as the stock has plunged – a typically bearish sign that confirms that volatility (and the panic associated with it) is also increasing. For extremely short-term traders, the good news is that several short-term oscillators are hinting that DISCA may have just made a minor five and 10-day cycle low and may still be able to muster a bit more of a bounce during the next few sessions. The bad news is that once this minor bounce ends, the selling may again kick in, with DISCA likely on track to eventually hit key support levels between 69.00 (its 200-day exponential moving average, or EMA) and 71.00 (the general area of the extreme lower Keltner band, which is set at 9.5 times the distance of the 50-period ATR for DISCA on its 130-minute chart). |
|
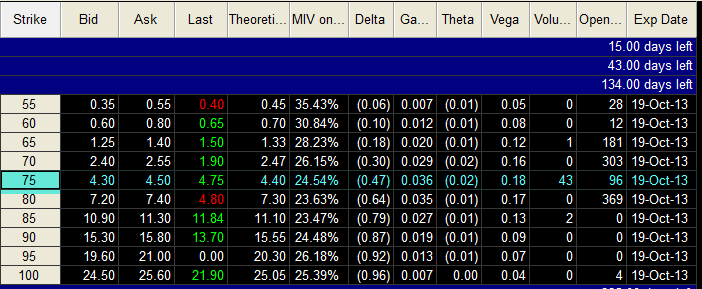
| Figure 2. The October '13 DISCA put option features a decent bid/ask spread, modest time decay, plenty of time till expiration and worthwhile daily trading volume. |
| Graphic provided by: TradeStation. |
| Graphic provided by: TradeStation Radar Screen. |
| |
| The most sensible way to play DISCA here is to either short the shares and/or buy at-the-money put options once the latest swing low at 74.15 is taken out. If shorting the shares (be sure to use a 130-minute chart like this one), run a three bar trailing stop of the highs, being sure to take at least half (if not all) profits as the 71.00 area is reached. More adventurous traders may want to try and hold on for a possible spike down toward the 69.00 support level, using the same trailing stop. Speculative bears can also buy the October '13 DISCA $75.00 put option; this option has plenty of time value, with daily time decay coming in at only $2 per day/per contract. The bid/ask spread is decent and the put has 96 contracts of open interest. If trading these puts, try to close out the entire position if 71.00 to 71.50 is reached and/or if the option doubles in price; windfall put option profits have a nasty way of suddenly vanishing as soon as a short-covering rally hits in a heavily oversold stock, causing unnecessary grief for inattentive traders. If the trade fails to follow through and the stock recovers quickly, sell your puts if they decline in value by 50%. This potential short setup, if triggered, qualifies as a continuation move and therefore you can afford to be a bit more aggressive with the amount of account risk you take on – but by no means risk more than 2% of your account value on this trade, no matter how much you may agree with my evaluation of DISCA. Trade wisely until we meet here again. |
Freelance financial markets writer and online publisher of the Trendzetterz.com S&P 500 Weekly Forecast service.
| Title: | Market consultant and writer |
| Company: | Trendzetterz |
| Address: | 81 Hickory Hollow Drive |
| Crossville, TN 38555 | |
| Phone # for sales: | 904-303-4814 |
| Website: | trendzetterz.com |
| E-mail address: | support@trendzetterz.com |
Traders' Resource Links | |
| Trendzetterz has not added any product or service information to TRADERS' RESOURCE. | |
Click here for more information about our publications!
Comments

Request Information From Our Sponsors
- StockCharts.com, Inc.
- Candle Patterns
- Candlestick Charting Explained
- Intermarket Technical Analysis
- John Murphy on Chart Analysis
- John Murphy's Chart Pattern Recognition
- John Murphy's Market Message
- MurphyExplainsMarketAnalysis-Intermarket Analysis
- MurphyExplainsMarketAnalysis-Visual Analysis
- StockCharts.com
- Technical Analysis of the Financial Markets
- The Visual Investor
- VectorVest, Inc.
- Executive Premier Workshop
- One-Day Options Course
- OptionsPro
- Retirement Income Workshop
- Sure-Fire Trading Systems (VectorVest, Inc.)
- Trading as a Business Workshop
- VectorVest 7 EOD
- VectorVest 7 RealTime/IntraDay
- VectorVest AutoTester
- VectorVest Educational Services
- VectorVest OnLine
- VectorVest Options Analyzer
- VectorVest ProGraphics v6.0
- VectorVest ProTrader 7
- VectorVest RealTime Derby Tool
- VectorVest Simulator
- VectorVest Variator
- VectorVest Watchdog