HOT TOPICS LIST
- MACD
- Fibonacci
- RSI
- Gann
- ADXR
- Stochastics
- Volume
- Triangles
- Futures
- Cycles
- Volatility
- ZIGZAG
- MESA
- Retracement
- Aroon
INDICATORS LIST
LIST OF TOPICS
PRINT THIS ARTICLE
by Donald W. Pendergast, Jr.
Citigroup shares have finally started to correct, but will a fast-approaching support area have what it takes to stop a further decline?
Position: N/A
Donald W. Pendergast, Jr.
Freelance financial markets writer and online publisher of the Trendzetterz.com S&P 500 Weekly Forecast service.
PRINT THIS ARTICLE
Citigroup: Major Support Test Imminent?
06/06/13 03:24:53 PMby Donald W. Pendergast, Jr.
Citigroup shares have finally started to correct, but will a fast-approaching support area have what it takes to stop a further decline?
Position: N/A
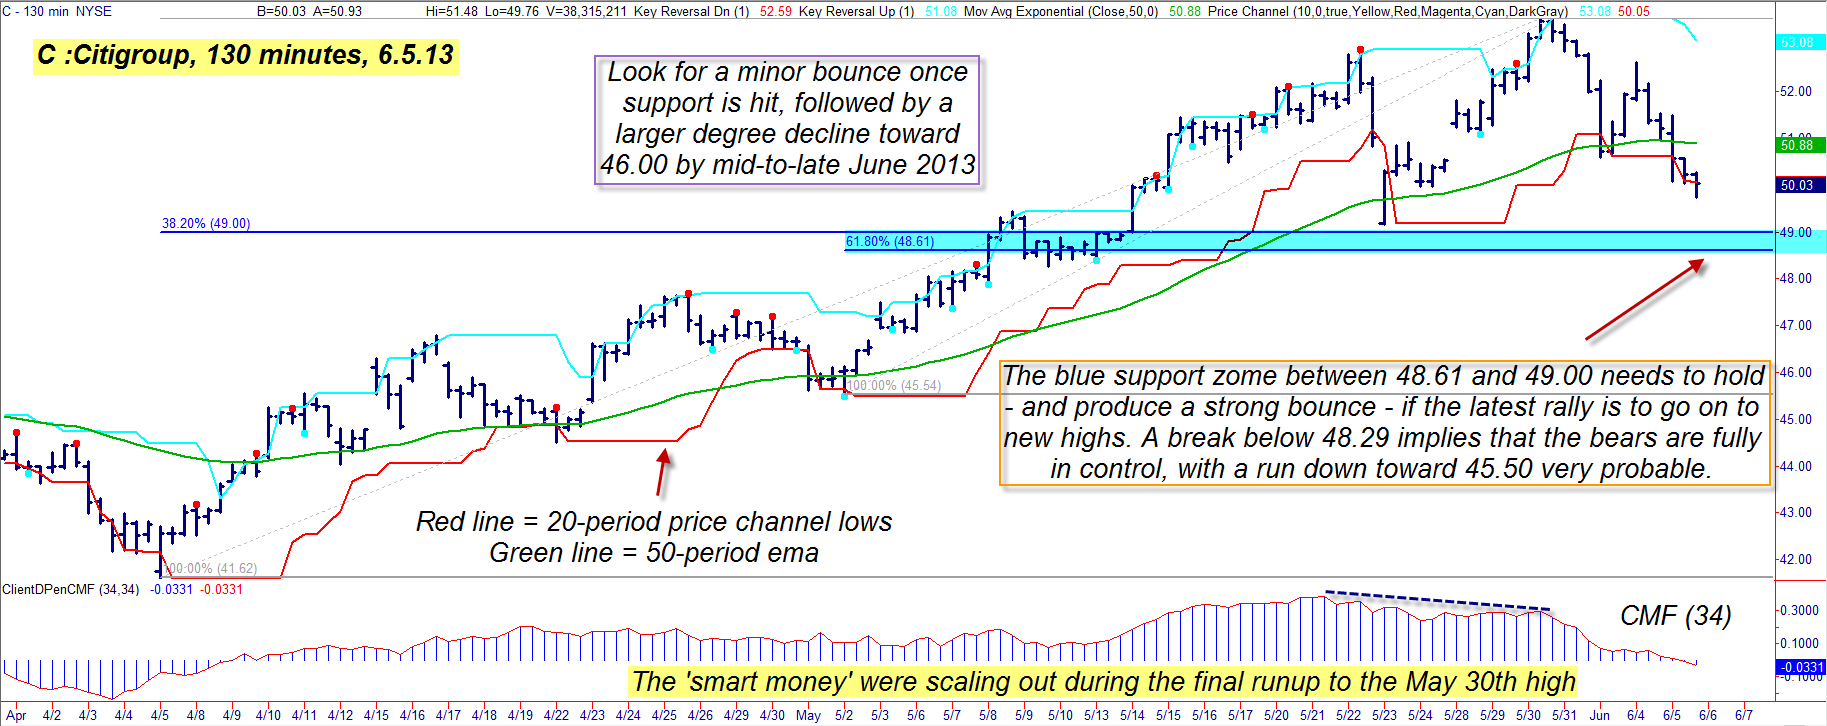
| A few days ago I made the case for a sell-off of some magnitude in financial sector stocks; well, the decline is now underway, with major banks, insurers and broker-dealer stocks getting revalued to the downside. Many of these stocks are now within close range of significant support levels - levels that need to hold if there is any hope of the major rally of October 2011 to May 2013 to continue on to higher levels. Here's a look at an interesting intraday timeframe chart for Citigroup, a major financial sector issue (Figure 1). |

|
| Figure 1: Probabilities are high that Citigroup (C) shares will test the blue support level within the next few trading sessions. |
| Graphic provided by: TradeStation. |
| |
| Shares of Citigroup (C) have done just dandy since the major market-wide low made back on October 4, 2012; by the time May 30, 2013, rolled around, the stock had gained 143%. From April 5, 2013, to May 30, 2013, C increased in value by nearly 29% – a great run for any large cap stock, financial sector component or not. The ultimate cycle high of May 30, 2013, wasn't entirely unexpected, however; on the 130-minute bar chart (an unusual time frame, but it divides the regular US stock trading session into three equal time value bars) we find that the "smart money" had begun to actively distribute their shares a few days before the high was actually made. The 34-period Chaikin money flow histogram was used to help confirm this; basically, when you see a stock continuing to rally even as its Chaikin money flow histogram continues to make lower peaks, then you know you are approaching a potential for a tradable correction of some degree. That correction is continuing, with C having just broken below both its 50-period exponential moving average (EMA in green) and its red 20-period lower price channel; the stock is now at 50.03 and is likely to meet its next strong support level at 49.18 (the prior swing low) within the next trading session or two. If that level is breached, there is a Fibonacci confluence support zone between 48.61 to 49.00 (blue shaded area) that may prove to be a bit tougher to penetrate - at least on the first try. Money flow is actually below its zero line, however, and the bulls better act in a hurry to buy shares in C if they expect those support levels to hold for any length of time. Overall, the chart for C in Figure 1 paints a rather bearish picture and the bears might want to prepare for further declines through the month of June 2013. |

|
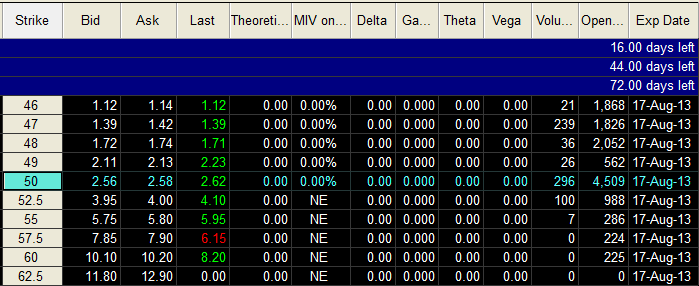
| Figure 2: The August '13 Citigroup $50.00 put option has a very close bid/ask spread and a large open interest figure of more than 4,500 contracts. |
| Graphic provided by: TradeStation. |
| Graphic provided by: TradeStation Radar Screen. |
| |
| If you see that C has a weak and/or nonexistent bounce after dipping into the blue support zone on the chart, consider the following long put play: 1. Buy the August '13 C $50.00 put option if C drops below 48.61. Risk no more than 2% of your account value on this trade, setting a maximum loss of 50% of the price you pay for the put. 2. The next lower support zone is near 45.50, so try to hold at least half your position until this level is reached - assuming it even gets that far. Consider taking the other half off if 46.75 is reached. And if your long C put increases in value by 100% at any point, consider just winding up the entire trade and rising off into the sunset - why risk losing such a great profit, holding on for more gains that may never even materialize? Financial stocks tend to move the S&P 500 index in a big way, and this chart seems to imply that the line of least resistance for C is toward lower prices for the balance of June 2013 - and perhaps even beyond. Trade wisely until we meet again. |
Freelance financial markets writer and online publisher of the Trendzetterz.com S&P 500 Weekly Forecast service.
| Title: | Market consultant and writer |
| Company: | Trendzetterz |
| Address: | 81 Hickory Hollow Drive |
| Crossville, TN 38555 | |
| Phone # for sales: | 904-303-4814 |
| Website: | trendzetterz.com |
| E-mail address: | support@trendzetterz.com |
Traders' Resource Links | |
| Trendzetterz has not added any product or service information to TRADERS' RESOURCE. | |
Click here for more information about our publications!
Comments

Request Information From Our Sponsors
- StockCharts.com, Inc.
- Candle Patterns
- Candlestick Charting Explained
- Intermarket Technical Analysis
- John Murphy on Chart Analysis
- John Murphy's Chart Pattern Recognition
- John Murphy's Market Message
- MurphyExplainsMarketAnalysis-Intermarket Analysis
- MurphyExplainsMarketAnalysis-Visual Analysis
- StockCharts.com
- Technical Analysis of the Financial Markets
- The Visual Investor
- VectorVest, Inc.
- Executive Premier Workshop
- One-Day Options Course
- OptionsPro
- Retirement Income Workshop
- Sure-Fire Trading Systems (VectorVest, Inc.)
- Trading as a Business Workshop
- VectorVest 7 EOD
- VectorVest 7 RealTime/IntraDay
- VectorVest AutoTester
- VectorVest Educational Services
- VectorVest OnLine
- VectorVest Options Analyzer
- VectorVest ProGraphics v6.0
- VectorVest ProTrader 7
- VectorVest RealTime Derby Tool
- VectorVest Simulator
- VectorVest Variator
- VectorVest Watchdog
