HOT TOPICS LIST
- MACD
- Fibonacci
- RSI
- Gann
- ADXR
- Stochastics
- Volume
- Triangles
- Futures
- Cycles
- Volatility
- ZIGZAG
- MESA
- Retracement
- Aroon
INDICATORS LIST
LIST OF TOPICS
PRINT THIS ARTICLE
by Koos van der Merwe
That mantra "sell in May and go away" did not happen this year.
Position: Accumulate
Koos van der Merwe
Has been a technical analyst since 1969, and has worked as a futures and options trader with First Financial Futures in Johannesburg, South Africa.
PRINT THIS ARTICLE
ELLIOTT WAVE
Sell In May...
06/06/13 02:40:58 PMby Koos van der Merwe
That mantra "sell in May and go away" did not happen this year.
Position: Accumulate
| The "sell in May" mantra is well known, and most chartists prepare for it, looking for exit points and accumulating cash to purchase stocks in June. June and September are known as the quietest months of the year, but, with the "sell in May" mantra not happening this year, will June truly be a quiet month? The S&P100 index differs from the S&P500 index with its Elliott wave analysis, and suggests that the expected correction, a correction that should have occurred in May, may not be as bad as expected. |

|
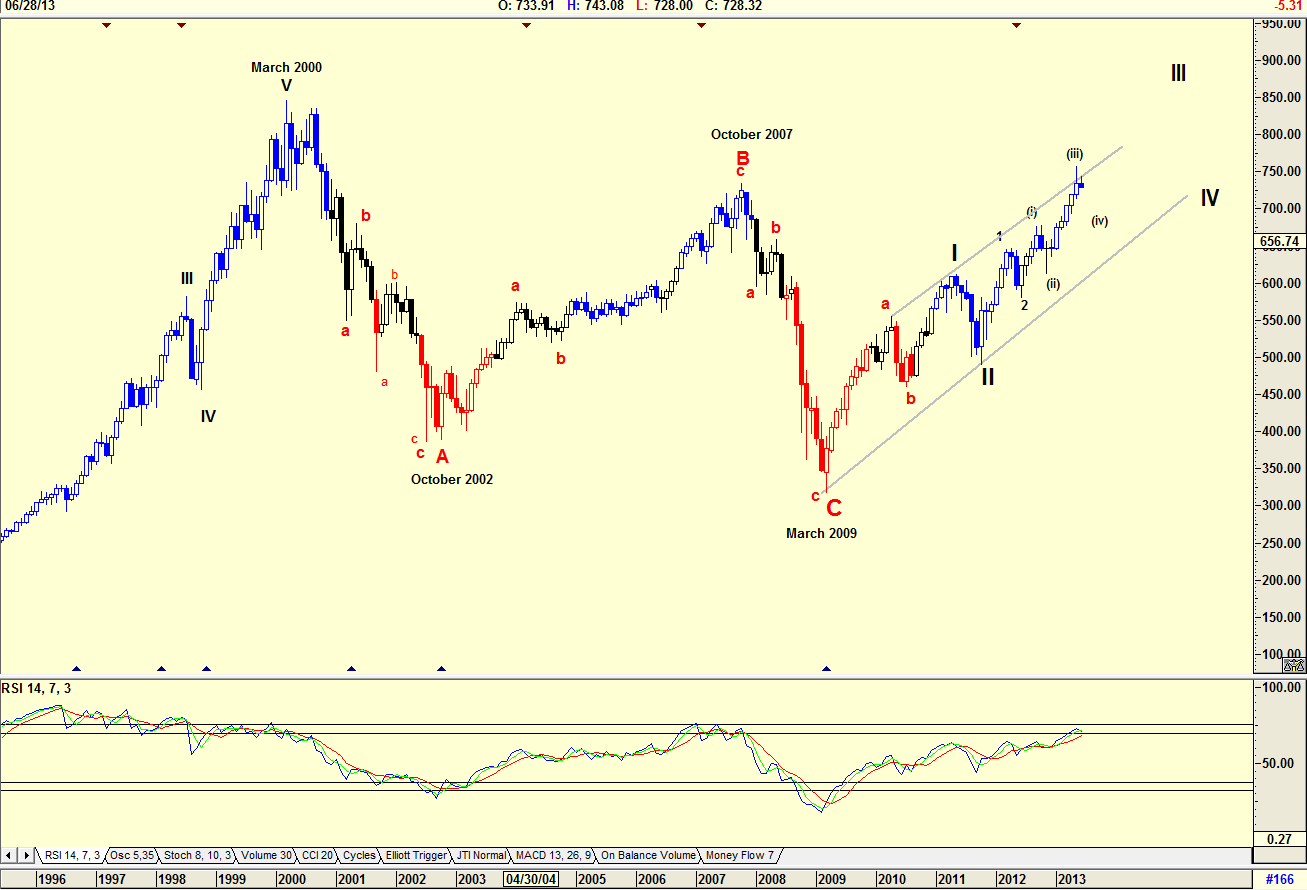
| Figure 1. Monthly chart of the S&P100 Index (.OEX) |
| Graphic provided by: AdvancedGET. |
| |
| The monthly chart in Figure 1 tells us that the S&P100 index is in a major bull trend. The chart tells us that the bear market ended in March 2009, and that the trend is presently in a major WAVE III bull market. What is a puzzle, and one I have found often occurring in a WAVE 1, is the abc correction in wave 1 shown on the chart. My research has shown that a wave 1 has become a complicated wave because too many out there believe that it is part of the down correction. Whether this is because of computer trading where algorithms have not been adjusted to handle a new bull market, is purely guess work on my part, but I can think of no other explanation as to why this change in the Elliott wave pattern is occurring. Wave 1 has always been a complicated wave, with a wave 2 often a 72% retracement of wave 1. |

|
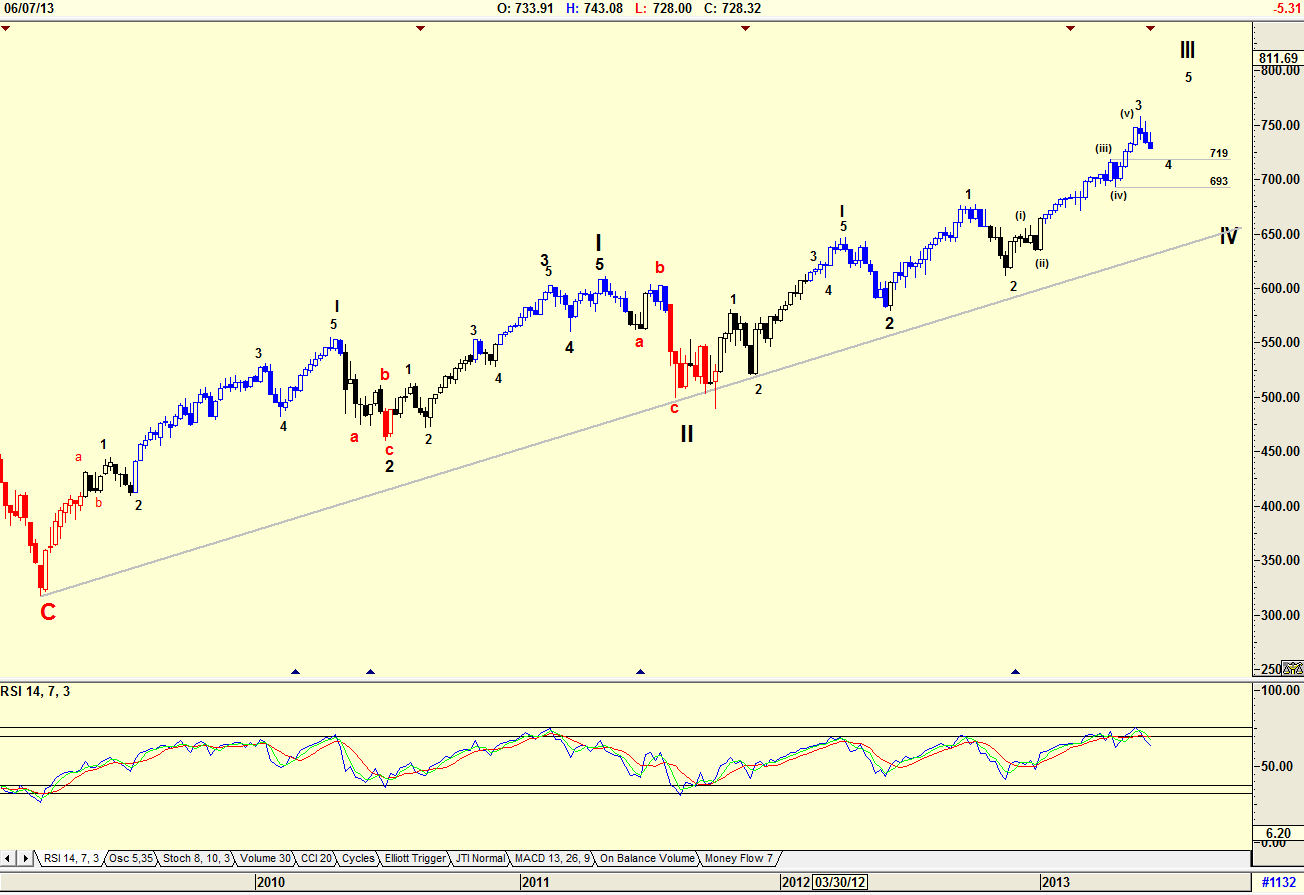
| Figure 2. Weekly chart of the S&P100 Index |
| Graphic provided by: AdvancedGET. |
| |
| In Figure 2, the chart is an Elliott wave count suggesting that the OEX is in a Wave 4 of WAVE III bull market. The RSI indicator is confirming the Wave 4 correction, a correction that will confirm June's quiet trend. The wave should correct at the 4th wave of lesser degree, in other words, not fall below 693. The index should then rise in a wave 5 to complete WAVE III, which will be followed by a WAVE IV bringing the index back to the 719 level. |

|
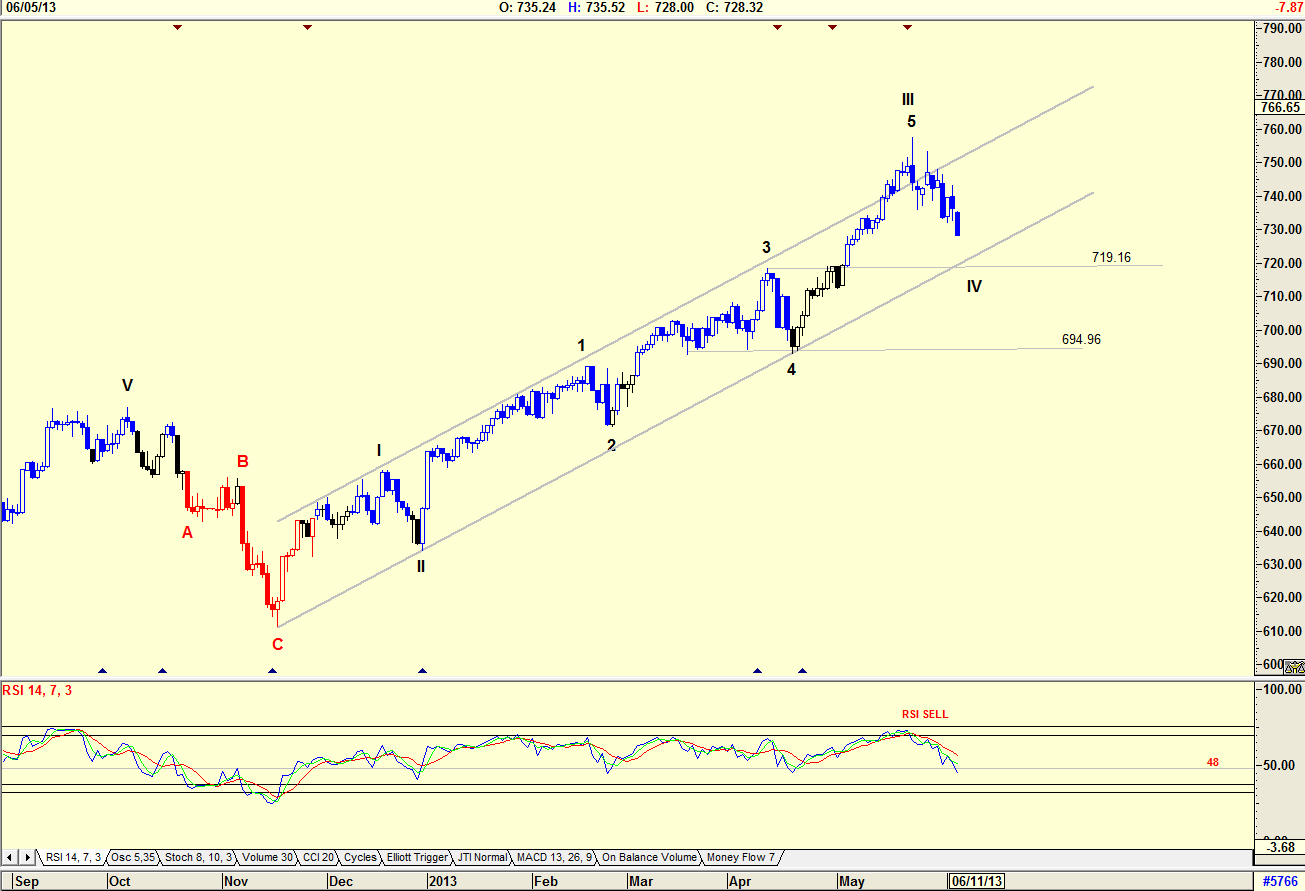
| Figure 3. Daily chart of the S&P100 Index |
| Graphic provided by: AdvancedGET. |
| |
| The daily chart in Figure 3 shows that the index is indeed in a WAVE IV correction, which will see it drop to somewhere between the 719.16 and 694.96 level. The RSI indicator is trending down, but notice that it tends to turn at the 48 level and not the 32 level for intra-wave counts. The support line shown on the chart suggests that the index may not fall as low as 719.16. Yes, the index does suggest that the "sell in May" mantra may have fallen into the month of June, but with June known as the second quietest month of a year, after September, we can expect the market to slow. Do your homework, and make a list of stocks you would like to own. That 5th wave should give you short-term growth profits, as long as you keep your stops close. |
Has been a technical analyst since 1969, and has worked as a futures and options trader with First Financial Futures in Johannesburg, South Africa.
| Address: | 3256 West 24th Ave |
| Vancouver, BC | |
| Phone # for sales: | 6042634214 |
| E-mail address: | petroosp@gmail.com |
Click here for more information about our publications!
Comments
Date: 06/13/13Rank: 5Comment:

Request Information From Our Sponsors
- StockCharts.com, Inc.
- Candle Patterns
- Candlestick Charting Explained
- Intermarket Technical Analysis
- John Murphy on Chart Analysis
- John Murphy's Chart Pattern Recognition
- John Murphy's Market Message
- MurphyExplainsMarketAnalysis-Intermarket Analysis
- MurphyExplainsMarketAnalysis-Visual Analysis
- StockCharts.com
- Technical Analysis of the Financial Markets
- The Visual Investor
- VectorVest, Inc.
- Executive Premier Workshop
- One-Day Options Course
- OptionsPro
- Retirement Income Workshop
- Sure-Fire Trading Systems (VectorVest, Inc.)
- Trading as a Business Workshop
- VectorVest 7 EOD
- VectorVest 7 RealTime/IntraDay
- VectorVest AutoTester
- VectorVest Educational Services
- VectorVest OnLine
- VectorVest Options Analyzer
- VectorVest ProGraphics v6.0
- VectorVest ProTrader 7
- VectorVest RealTime Derby Tool
- VectorVest Simulator
- VectorVest Variator
- VectorVest Watchdog
