

HOT TOPICS LIST
- MACD
- Fibonacci
- RSI
- Gann
- ADXR
- Stochastics
- Volume
- Triangles
- Futures
- Cycles
- Volatility
- ZIGZAG
- MESA
- Retracement
- Aroon
INDICATORS LIST
LIST OF TOPICS
PRINT THIS ARTICLE
by Donald W. Pendergast, Jr.
After a massive multiyear bull run that produced gains of nearly 400%, shares of Home Depot are in the process of correcting.
Position: N/A
Donald W. Pendergast, Jr.
Freelance financial markets writer and online publisher of the Trendzetterz.com S&P 500 Weekly Forecast service.
PRINT THIS ARTICLE
CHART ANALYSIS
Home Depot: Due To Correct Further
06/05/13 02:43:23 PMby Donald W. Pendergast, Jr.
After a massive multiyear bull run that produced gains of nearly 400%, shares of Home Depot are in the process of correcting.
Position: N/A
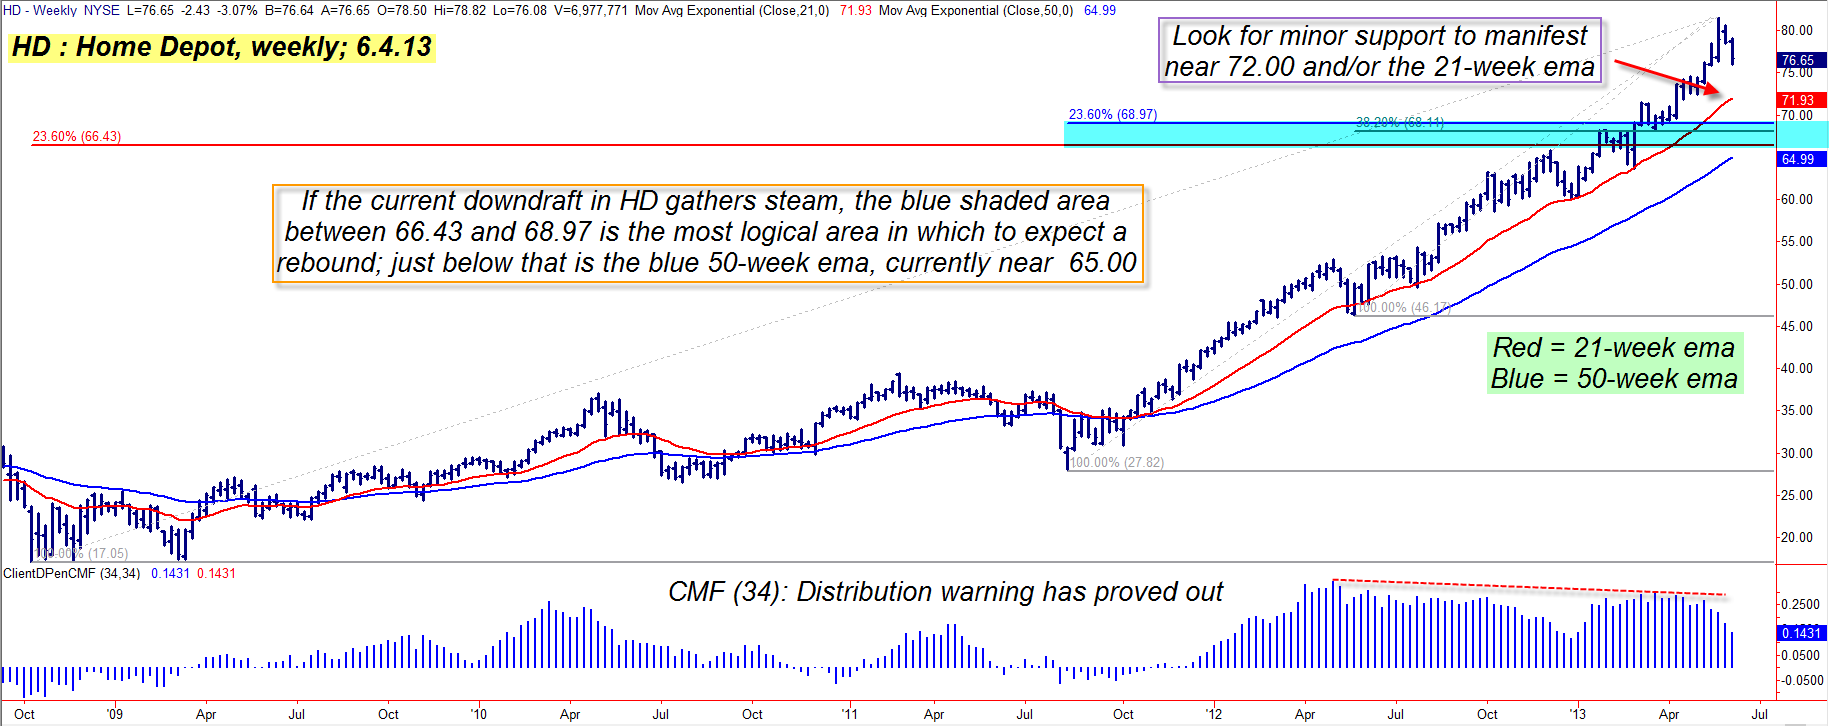
| Of all the stocks in the S&P 100 index (.OEX), Home Depot (HD) has done better than most since the generational stock market lows of October 2008 and/or March 2009; from its rock bottom low of 17.05 of October 10, 2008 to its recent major high of 81.56 (set on May 24, 2013), the stock has trended steadily during the past 4 1/2 years, with only minor corrections during its ascent. At the moment, however, HD – along with many other large caps in the .OEX and .SPX – appears to be on the cusp of what could be one of the larger corrections since coming out of its 2008/2009 lows. Here's a closer look. |
|
| Figure 1: After a nearly 400% rise since October 2008, shares of Home Depot (HD) may be preparing for a sizable correction. Note the strong multi-trend Fibonacci support levels between 66.43 and 68.97. |
| Graphic provided by: TradeStation. |
| |
| Home Depot's long-running uptrend can be divided into two phases (Figure 1): 1. The initial rebound phase that took place after rising from the October 2008 low of 17.05. This phase lasted until late February 2001 and was good for a 131% gain in about 28 1/2 months, or an average gain of 4.6% per month. This phase has some range-bound periods but the stock still managed to move up, despite a few pullbacks. 2. The next phase began after HD bottomed out in the wake of the summer 2011 Euro zone debt crisis sell-off; from a low of 28.13 on August 12, 2011, HD rose by 190% in 21 1/2 months, an average gain of about 8.75% per month. Clearly, HD's upward momentum had picked up lots of speed by the time it peaked out at 81.56 a couple of weeks ago; notice how much more steep the second phase of the rally was. The smart money in HD weren't so dumb as to believe that this trend would last forever, however, and beginning in August 2012 they began to progressively offload more and more of their shares to lesser informed traders and investors (the so-called "dumb money"); notice how the latest 34-week Chaikin Money flow histogram trend really began to fall off starting in April 2013, just prior to HD's final ascent to the $80-plus area. |
|
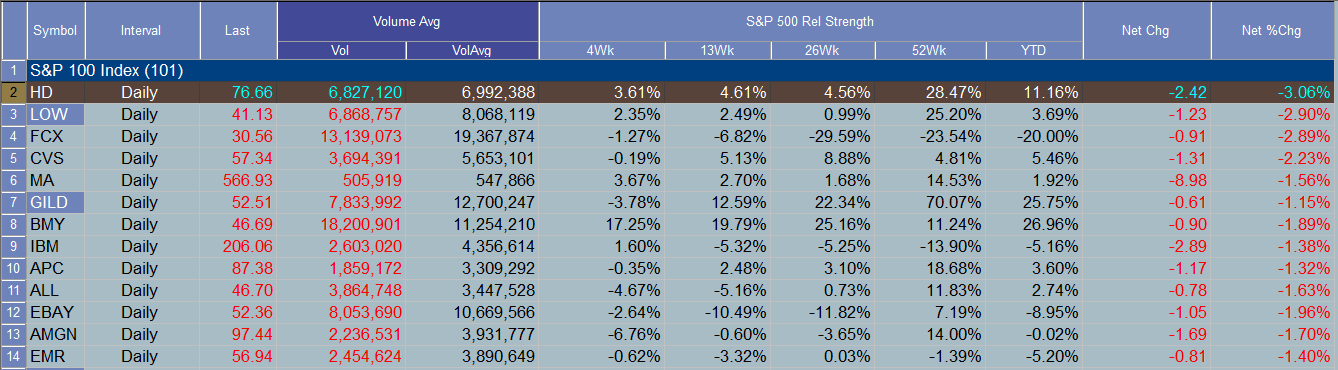
| Figure 2: Home Depot (HD) was the largest daily decliner within the S&P 100 index (.OEX) on Tuesday June 4, 2013. |
| Graphic provided by: TradeStation. |
| Graphic provided by: TradeStation Radar Screen. |
| |
| As this is written, HD is trading at 76.72 and is down by nearly 6% from its May 2013 highs, but this is not the time to consider buying HD, especially with its money flow trend rapidly disintegrating after a multiyear rally that appears to need a more substantial correction before solid support levels are reached. Here are some support areas to watch for in HD: 1. The 21-week exponential moving average (EMA), near 72.00 2. The multiple-trend Fib confluence agreement area (blue shaded area) between 66.43 and 68.97 3. The 50-week EMA, currently near 65.00 Current longs in HD should have already purchased some put option protection, if not already having liquidated some (or even all) of their position in the stock; speculative bears might want to consider the following long put play: 1. If HD drops below 76.00, consider buying the August '13 HD $77.50 put option; the bid-ask spread is decent and open interest is large at 5,167 contracts. This put offers 2 1/2 months of time value, which should be more than sufficient to take advantage of a sharp near-term decline in HD. 2. Once in the trade, use 72.00 as your profit target; more aggressive traders might want to take half near 72.00, holding on for a further decline toward the high $60s and/or the blue shaded support area. 3. Set your initial stop near 79.15, but then slowly drop it to lock in more gains and to reduce your risk exposure. By no means allow the put to lose more than 50% of its value before selling it. A fast gain of 100% or more should also motivate you to take some serious profits off the table, too. This is a reversal-style trade, so keep your per-trade risk to your account at 1 to 2%, maximum. The probabilities for another 5% decline in the major US stock indexes is very high now, so make sure you are prepared to seize attractive, low risk short selling and/or long put plays as they manifest in the days and weeks ahead. Trade wisely until we meet here again. |
Freelance financial markets writer and online publisher of the Trendzetterz.com S&P 500 Weekly Forecast service.
| Title: | Market consultant and writer |
| Company: | Trendzetterz |
| Address: | 81 Hickory Hollow Drive |
| Crossville, TN 38555 | |
| Phone # for sales: | 904-303-4814 |
| Website: | trendzetterz.com |
| E-mail address: | support@trendzetterz.com |
Traders' Resource Links | |
| Trendzetterz has not added any product or service information to TRADERS' RESOURCE. | |
Click here for more information about our publications!
PRINT THIS ARTICLE

Request Information From Our Sponsors
- StockCharts.com, Inc.
- Candle Patterns
- Candlestick Charting Explained
- Intermarket Technical Analysis
- John Murphy on Chart Analysis
- John Murphy's Chart Pattern Recognition
- John Murphy's Market Message
- MurphyExplainsMarketAnalysis-Intermarket Analysis
- MurphyExplainsMarketAnalysis-Visual Analysis
- StockCharts.com
- Technical Analysis of the Financial Markets
- The Visual Investor
- VectorVest, Inc.
- Executive Premier Workshop
- One-Day Options Course
- OptionsPro
- Retirement Income Workshop
- Sure-Fire Trading Systems (VectorVest, Inc.)
- Trading as a Business Workshop
- VectorVest 7 EOD
- VectorVest 7 RealTime/IntraDay
- VectorVest AutoTester
- VectorVest Educational Services
- VectorVest OnLine
- VectorVest Options Analyzer
- VectorVest ProGraphics v6.0
- VectorVest ProTrader 7
- VectorVest RealTime Derby Tool
- VectorVest Simulator
- VectorVest Variator
- VectorVest Watchdog