

HOT TOPICS LIST
- MACD
- Fibonacci
- RSI
- Gann
- ADXR
- Stochastics
- Volume
- Triangles
- Futures
- Cycles
- Volatility
- ZIGZAG
- MESA
- Retracement
- Aroon
INDICATORS LIST
LIST OF TOPICS
PRINT THIS ARTICLE
by Donald W. Pendergast, Jr.
Financial sector stocks enjoyed a major rally from October 2011 into May 2013 but a correction and/or trend reversal of the entire run higher appears to be in the works.
Position: N/A
Donald W. Pendergast, Jr.
Freelance financial markets writer and online publisher of the Trendzetterz.com S&P 500 Weekly Forecast service.
PRINT THIS ARTICLE
TECHNICAL ANALYSIS
Financial Sector Stocks Correction?
06/04/13 02:22:09 PMby Donald W. Pendergast, Jr.
Financial sector stocks enjoyed a major rally from October 2011 into May 2013 but a correction and/or trend reversal of the entire run higher appears to be in the works.
Position: N/A
| Financial sector stocks – those from the banking, insurance, broker-dealer industry groups, among others – have always helped lead the S&P 100/500 indexes higher (or lower) for a long time now – especially since the 1980s when such stocks began to make up a larger percentage of those two indexes, gradually pushing out older "legacy" smokestack-type industrial stocks as the US economy morphed from an industrial to a services-based economic model. The financial stocks put in a great run higher since October 2011, but the odds are increasing for a proportional correction of that astounding rally. Here's a closer look. |
|
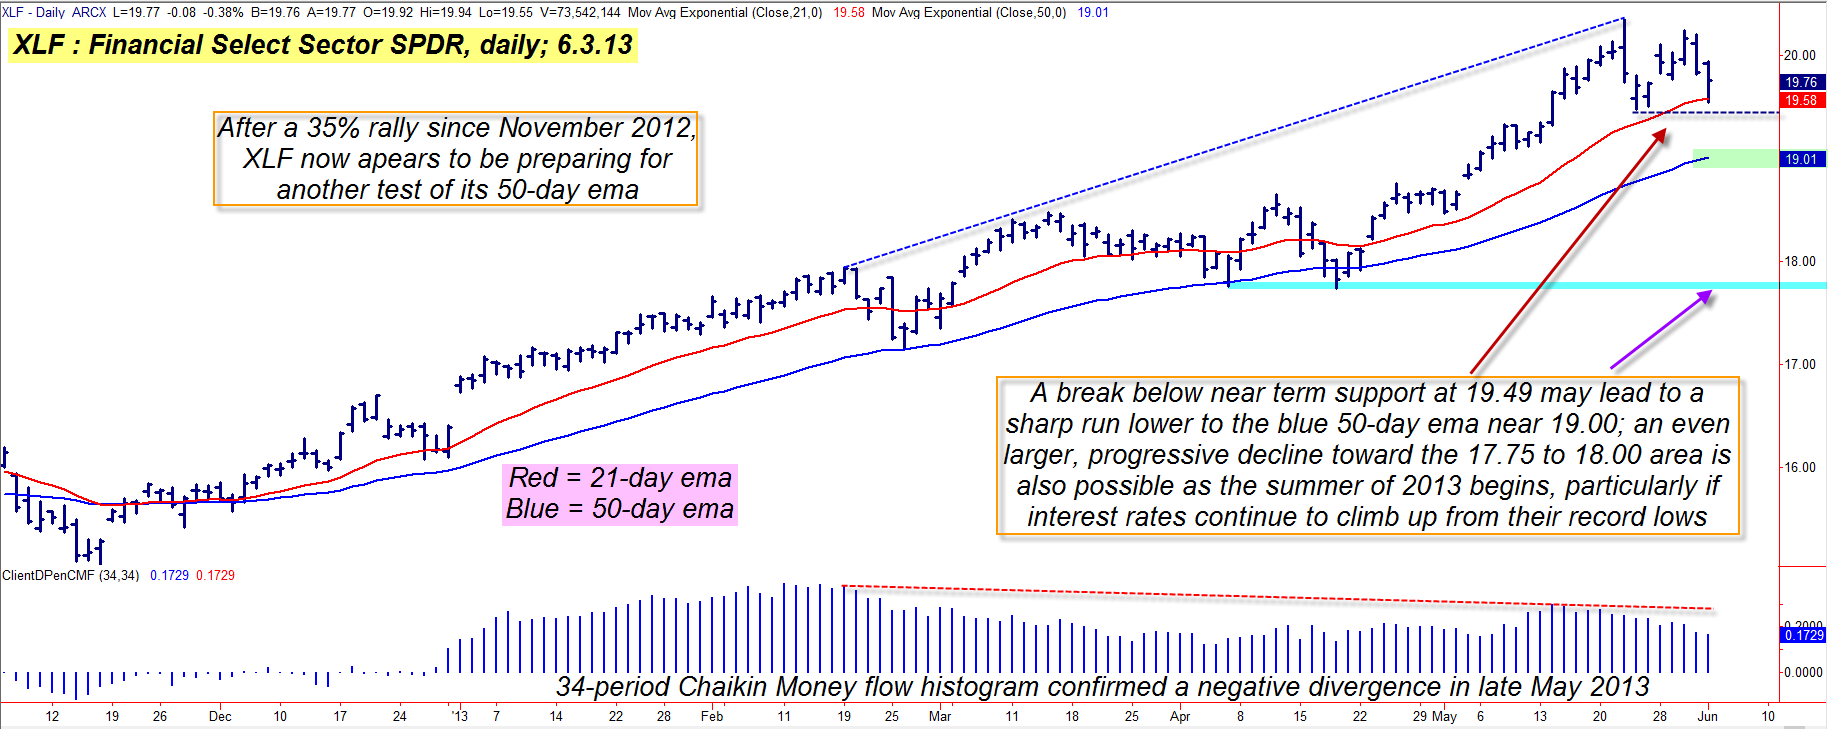
| Figure 1: Is the party in financials finally over – or not? Distribution is clearly underway, but another bounce higher is always possible. A clear break below 19.49 in XLF (Financial Select Sector SPDR) increases the odds for a fast drop toward support near 19.00. |
| Graphic provided by: TradeStation. |
| |
| Major multicycle lows, although impossible to predict with certainty – and which can only be confirmed in retrospect – are wonderful precursors to tradable rallies in most freely traded stocks, ETFs and futures/forex markets. The major cycle low that the Financial Select Sector SPDR (XLF) made on November 16, 2012 (Figure 1) was the predecessor market event prior to a 35%, six-month long rally that helped bank, insurance and broker/dealer stocks move higher with great speed and strength, and it has only been the past couple of weeks that XLF has begun to pause, having second thoughts about running even higher as we approach summer 2013. Notice that although the money flow histogram (the 34-day Chaikin money flow) is still well above its zero line, the latest peak was far short of the previous peak set in February 2013; this confirms that the "smart money" has, in aggregate, been distributing their shares of financial sector stocks to lesser-informed traders and investors in advance of another major multicycle high. Since peaking on May 22, 2013, XLF has formed a small consolidation box and this could be the setup for a final, last-gasp run higher or it could mean that XLF has already begun the process of turning lower in a major correction. The "line in the sand" to watch here is 19.49 – the bottom of the box pattern. A decline beneath 19.49 would seem to be the "all clear" signal for a strong selloff, one that could quickly descend to the blue 50-day exponential moving average (currently near 19.00). |
|
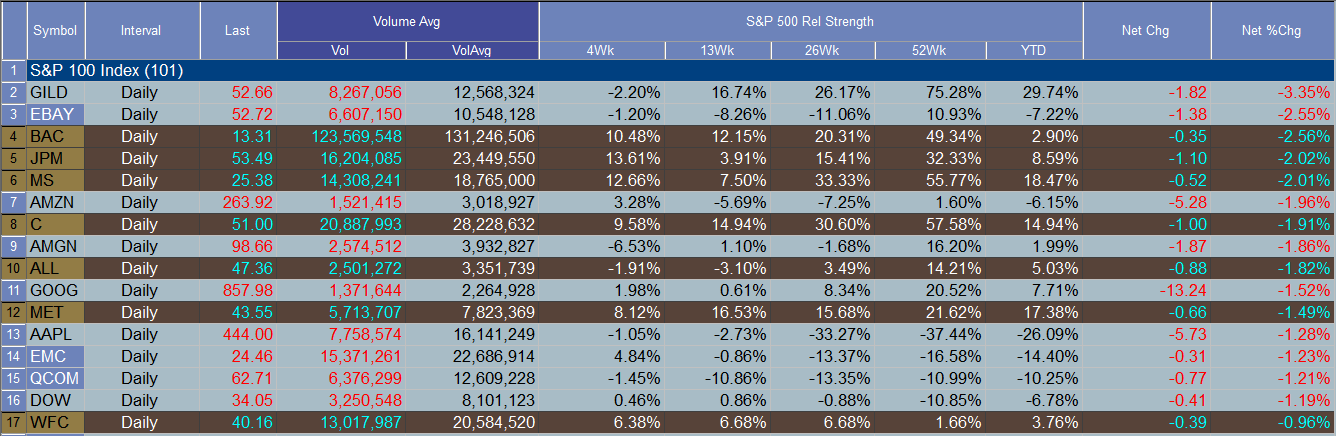
| Figure 2: Financials were some of the hardest-hit large cap stocks during the morning trading session on June 3, 2013. |
| Graphic provided by: TradeStation. |
| Graphic provided by: TradeStation Radar Screen. |
| |
| On Monday June 3, 2013, the markets made some strong moves lower in the morning session, only to rebound somewhat by the close; this was a likely support test, one that has, for the moment prevented a sharp, continued selloff. It's clear, however, that the markets are more volatile now than at any point since mid-April 2013, and that extreme caution should be used now, especially if you still are holding financial sector stocks – names like JPMorgan Chase (JPM), MetLife (MET) and Morgan Stanley (MS). Be sure you have an "exit" plan in place before you really need to use it, because the anticipated selloff could arrive with very short notice. Speculative bears might want to consider the following long put play: 1. If XLF drops below 19.49, consider buying the August '13 XLK $20.00 put option, risking no more than 1% of your account worth. 2. Use the 19.00 support level as your "take half profits" exit. 3. If there is only a minor bounce higher from the 19.00 area, consider holding on for further declines toward 18.00 to 18.50. 4. Manage the trade by selling the put(s) if they double in price or decline in value by half. At major market tops, volatility typically increases as the bulls and bears get progressively more desperate to force a trend resolution; make sure you're prepared to protect your hard-won financial sector stock gains and also ready to pounce on this potentially profitable long put play. Trade wisely until we meet here again. |
Freelance financial markets writer and online publisher of the Trendzetterz.com S&P 500 Weekly Forecast service.
| Title: | Market consultant and writer |
| Company: | Trendzetterz |
| Address: | 81 Hickory Hollow Drive |
| Crossville, TN 38555 | |
| Phone # for sales: | 904-303-4814 |
| Website: | trendzetterz.com |
| E-mail address: | support@trendzetterz.com |
Traders' Resource Links | |
| Trendzetterz has not added any product or service information to TRADERS' RESOURCE. | |
Click here for more information about our publications!
Comments

Request Information From Our Sponsors
- VectorVest, Inc.
- Executive Premier Workshop
- One-Day Options Course
- OptionsPro
- Retirement Income Workshop
- Sure-Fire Trading Systems (VectorVest, Inc.)
- Trading as a Business Workshop
- VectorVest 7 EOD
- VectorVest 7 RealTime/IntraDay
- VectorVest AutoTester
- VectorVest Educational Services
- VectorVest OnLine
- VectorVest Options Analyzer
- VectorVest ProGraphics v6.0
- VectorVest ProTrader 7
- VectorVest RealTime Derby Tool
- VectorVest Simulator
- VectorVest Variator
- VectorVest Watchdog
- StockCharts.com, Inc.
- Candle Patterns
- Candlestick Charting Explained
- Intermarket Technical Analysis
- John Murphy on Chart Analysis
- John Murphy's Chart Pattern Recognition
- John Murphy's Market Message
- MurphyExplainsMarketAnalysis-Intermarket Analysis
- MurphyExplainsMarketAnalysis-Visual Analysis
- StockCharts.com
- Technical Analysis of the Financial Markets
- The Visual Investor