HOT TOPICS LIST
- MACD
- Fibonacci
- RSI
- Gann
- ADXR
- Stochastics
- Volume
- Triangles
- Futures
- Cycles
- Volatility
- ZIGZAG
- MESA
- Retracement
- Aroon
INDICATORS LIST
LIST OF TOPICS
PRINT THIS ARTICLE
by Koos van der Merwe
Yahoo! was the web search ruler, then Google took over. What is the future like for Yahoo!?
Position: Sell
Koos van der Merwe
Has been a technical analyst since 1969, and has worked as a futures and options trader with First Financial Futures in Johannesburg, South Africa.
PRINT THIS ARTICLE
ELLIOTT WAVE
A Look At Yahoo!
06/03/13 04:23:57 PMby Koos van der Merwe
Yahoo! was the web search ruler, then Google took over. What is the future like for Yahoo!?
Position: Sell
| Yahoo! was once the ruler in search engines. Google took over and is now the most popular, but various attachments that were added to Google Chrome, may hurt its popularity. Is it time to look at Yahoo! once again? Yahoo.com remains one of the web's most trafficked sites. It had 119 million monthly visitors in January, up 9% from a year earlier, according to ComScore (SCOR). With Yahoo! Chief Executive Marissa Mayer giving her company a radical polish, the share does deserve a look. |

|
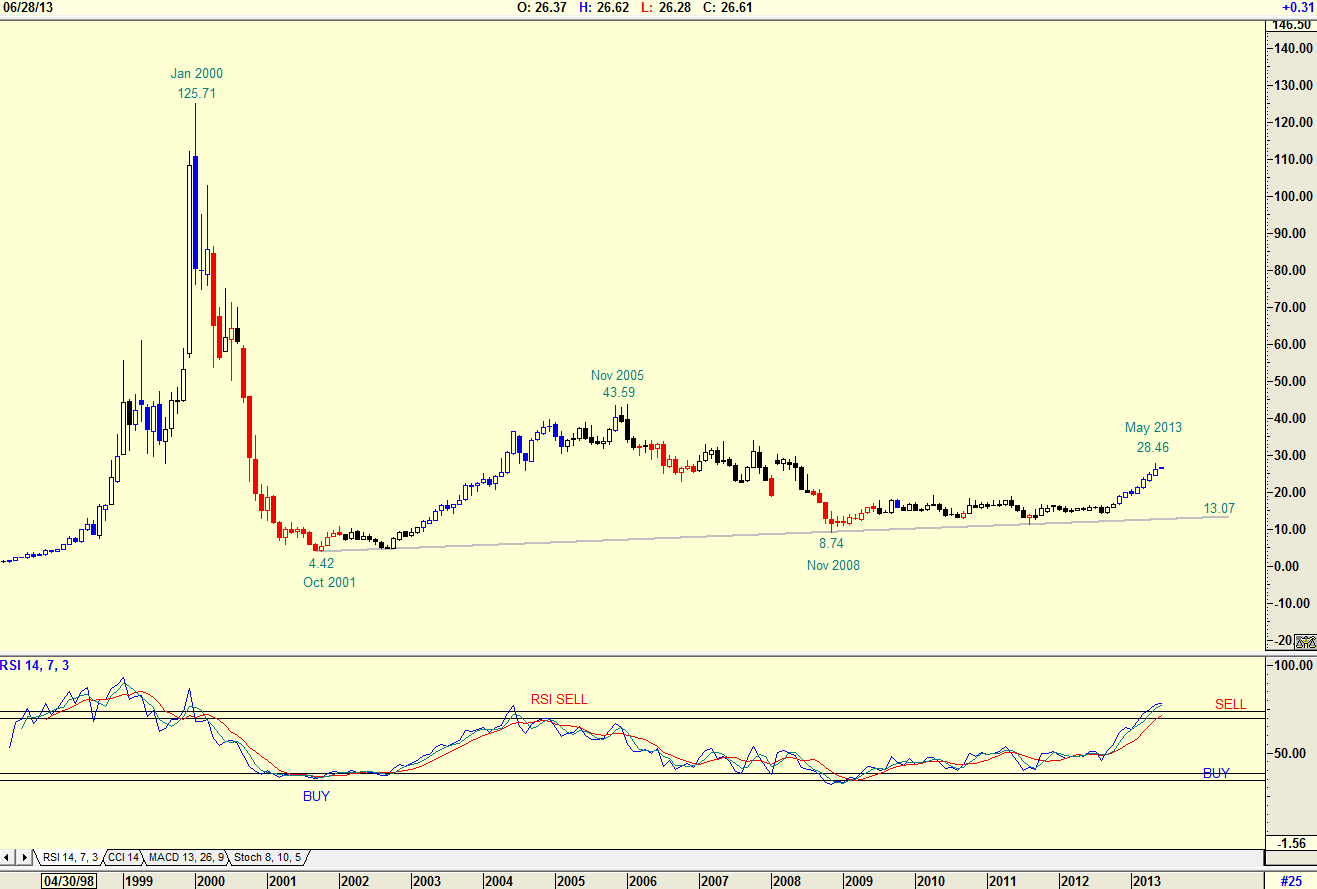
| Figure 1: Monthly chart for YHOO. |
| Graphic provided by: AdvancedGET. |
| |
| The monthly chart in Figure 1 shows how the price of Yahoo! fell from a high of $125.71 in January 2000 to a low of $4.42 by October 2001. This drop was in line with the technology bubble bursting. The share price then rose on an RSI buy to a high of $43.59 by November 2005, before falling to $8.74 by November 2008. Since then the price has gradually risen to $28.456 by May 2013, the RSI indicator at overbought levels. This suggests that we could see a correction to $13.07, the major support line. |

|
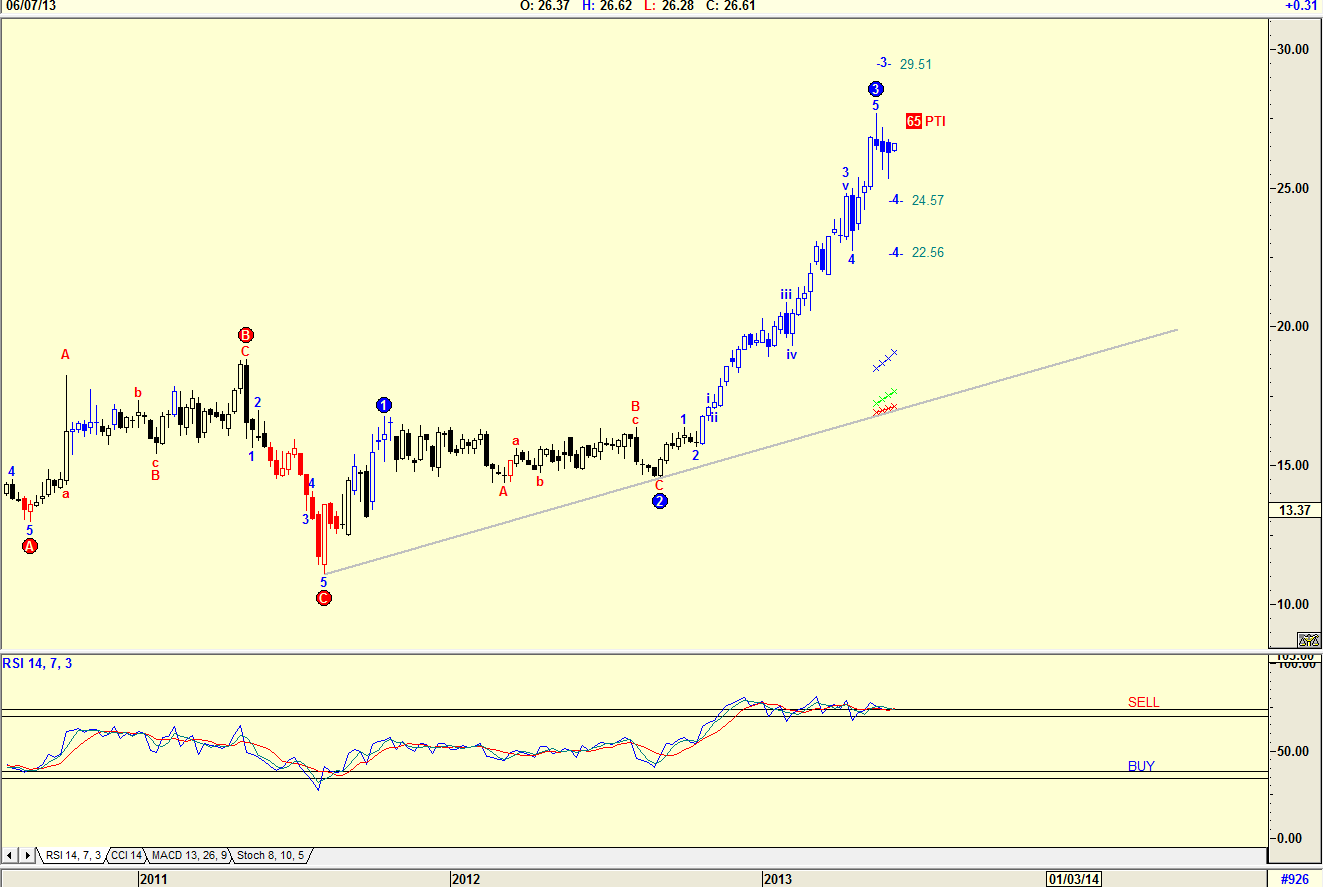
| Figure 2: Weekly chart for YHOO with Elliott wave count. |
| Graphic provided by: AdvancedGET. |
| |
| The weekly chart in Figure 2 shows Yahoo! with an Elliott wave count. The Elliott wave does show that a Wave 3 could have been completed, with the possibility that the share price could still rise to $29.52 for a Wave 3 top. With the RSI indicator at overbought levels, however, and with the probability index (PTI) at 65, the likelihood of a fall to either $24.57 or $22.56 is more than likely. |

|
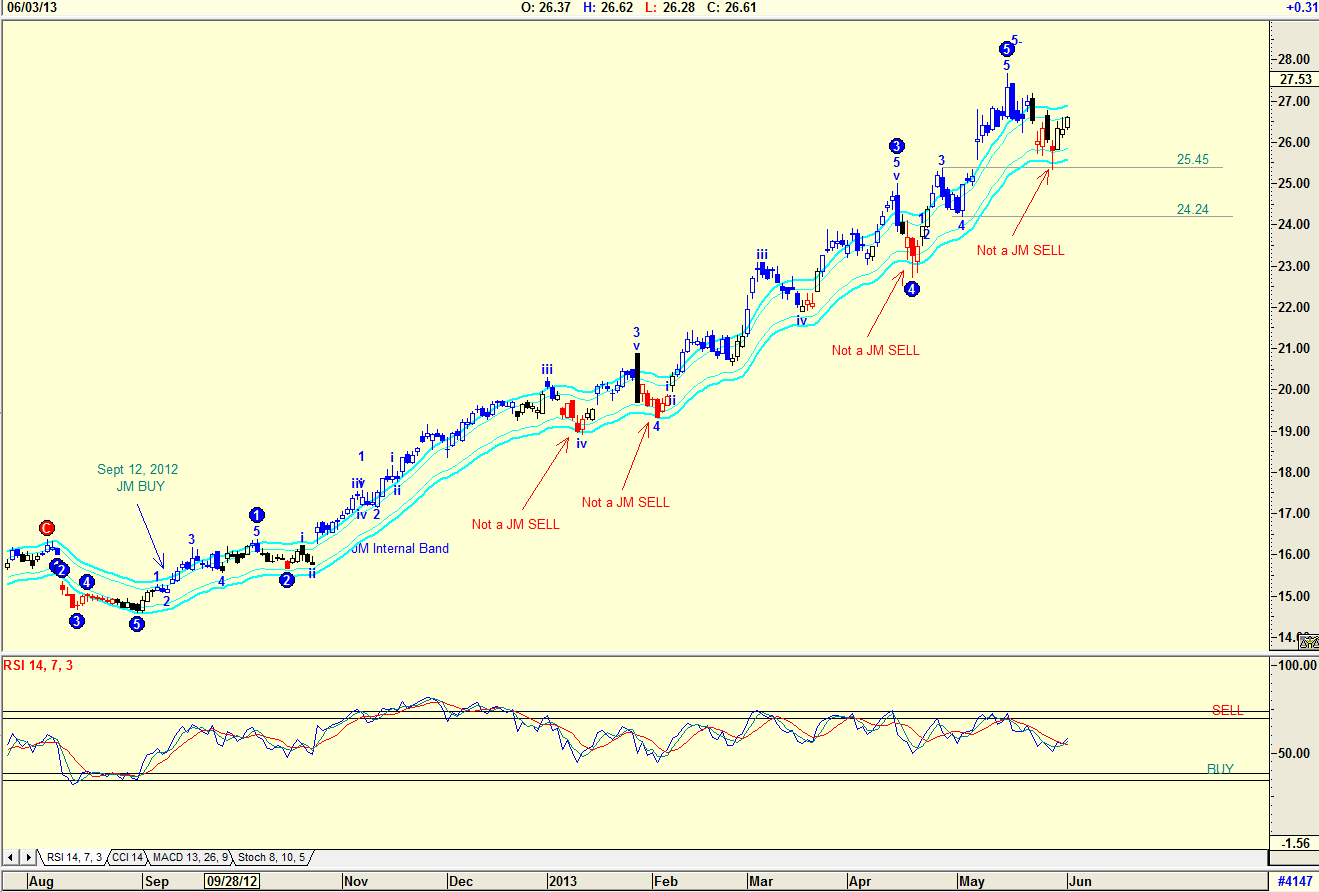
| Figure 3: Daily chart for YHOO with JM internal band indicator and Elliott Wave count. |
| Graphic provided by: AdvancedGET. |
| |
| The daily chart in Figure 3 shows an Elliott wave count and a JM internal band. The Elliott wave count is suggesting that a Wave 5 has been completed and that we could now expect an ABC correction to the fourth wave of lesser degree, that is, somewhere between $24.24 and $25.45. The JM internal band indicator gave a buy signal on September 12, 2012 and although the price tested the lower band on four occasions, a sell signal was not given because the closing price did not break below the lower band. The JM internal band indicator is a 15-period simple moving average offset by 2% positive and 2% negative. I would not be a buyer of Yahoo! at present levels. I would rather wait for the correction to somewhere between $24.24 and $25.45 to occur. |
Has been a technical analyst since 1969, and has worked as a futures and options trader with First Financial Futures in Johannesburg, South Africa.
| Address: | 3256 West 24th Ave |
| Vancouver, BC | |
| Phone # for sales: | 6042634214 |
| E-mail address: | petroosp@gmail.com |
Click here for more information about our publications!
Comments
Date: 06/05/13Rank: 4Comment:

|

Request Information From Our Sponsors
- VectorVest, Inc.
- Executive Premier Workshop
- One-Day Options Course
- OptionsPro
- Retirement Income Workshop
- Sure-Fire Trading Systems (VectorVest, Inc.)
- Trading as a Business Workshop
- VectorVest 7 EOD
- VectorVest 7 RealTime/IntraDay
- VectorVest AutoTester
- VectorVest Educational Services
- VectorVest OnLine
- VectorVest Options Analyzer
- VectorVest ProGraphics v6.0
- VectorVest ProTrader 7
- VectorVest RealTime Derby Tool
- VectorVest Simulator
- VectorVest Variator
- VectorVest Watchdog
- StockCharts.com, Inc.
- Candle Patterns
- Candlestick Charting Explained
- Intermarket Technical Analysis
- John Murphy on Chart Analysis
- John Murphy's Chart Pattern Recognition
- John Murphy's Market Message
- MurphyExplainsMarketAnalysis-Intermarket Analysis
- MurphyExplainsMarketAnalysis-Visual Analysis
- StockCharts.com
- Technical Analysis of the Financial Markets
- The Visual Investor
