HOT TOPICS LIST
- MACD
- Fibonacci
- RSI
- Gann
- ADXR
- Stochastics
- Volume
- Triangles
- Futures
- Cycles
- Volatility
- ZIGZAG
- MESA
- Retracement
- Aroon
INDICATORS LIST
LIST OF TOPICS
PRINT THIS ARTICLE
by Donald W. Pendergast, Jr.
After enduring a month-long decline of more than 8%, the Australian Dollar/US Dollar currency pair may be setting up for a bullish reversal.
Position: N/A
Donald W. Pendergast, Jr.
Freelance financial markets writer and online publisher of the Trendzetterz.com S&P 500 Weekly Forecast service.
PRINT THIS ARTICLE
RSI
AUD/USD: Setting Up For A Rally?
05/31/13 02:31:50 PMby Donald W. Pendergast, Jr.
After enduring a month-long decline of more than 8%, the Australian Dollar/US Dollar currency pair may be setting up for a bullish reversal.
Position: N/A
| Since late April 2013 the Australian Dollar (AUD) has been progressively weakening against the US Dollar (USD), and with the AUD/USD currency pair down by a maximum of 8.25% in barely four weeks, it would appear at first glance that this is the start of an even greater bearish move for the pair. However, the combination of a key price pattern breakout along with bullish momentum divergence is now suggesting that the AUD/USD may soon be due for a relief rally of some magnitude. Here's a closer look. |

|
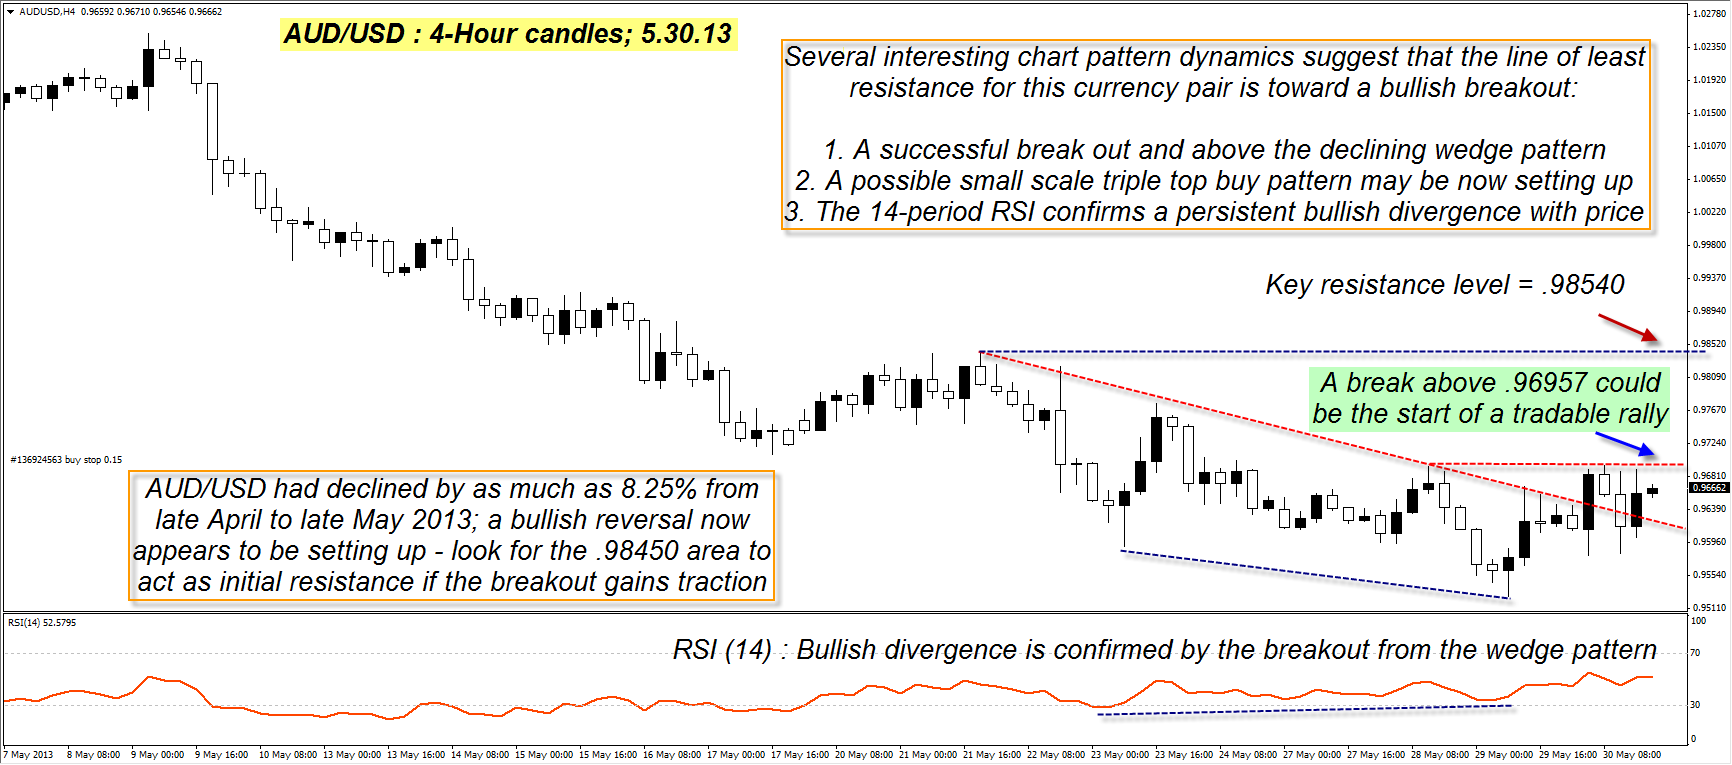
| Figure 1: Now that the AUD/USD is finally trading out/above its recent declining wedge pattern, the probabilities increase for a breakout attempt above the .96957 level. |
| Graphic provided by: MetaTrader 4. |
| |
| The most prominent technical on the 4-hour chart (Figure 1) is the well-defined descending wedge pattern – a pattern typically seen near the end of a substantial selloff – and the AUD/USD has managed to finally break out/above the top channel line of the pattern even as a convincingly bullish price/momentum divergence (based on the 14-period RSI) was also proving itself out. The pair is still trading outside the wedge's upper boundary and may now even be setting up for another surge higher; a rise above .96957 (lower red horizontal line) could lead to even more bullish follow-through. If a rally gains traction, however, look for resistance near .98250 to .98450 to act as strong initial resistance (blue dashed line). And as far as the fundamental economic reasons for the Australian currency to weaken against the US Dollar, although there are a near-infinite number of reasons why this is happening, here are a few things that may be the primary drivers for such a comparative revaluation: 1. The current bond market scare in Japan is spooking those holding all Asian-area currencies – including the AUD. 2. During such times of economic turmoil, the US Dollar is still viewed by many around the globe as a last-resort "safe haven". 3. A gradually slowing (in terms of annualized GDP growth) economy in China also infers less demand for Australian natural resources (Australia is an important supplier of many raw materials for the Chinese economy) and therefore less demand for the AUD. |

|
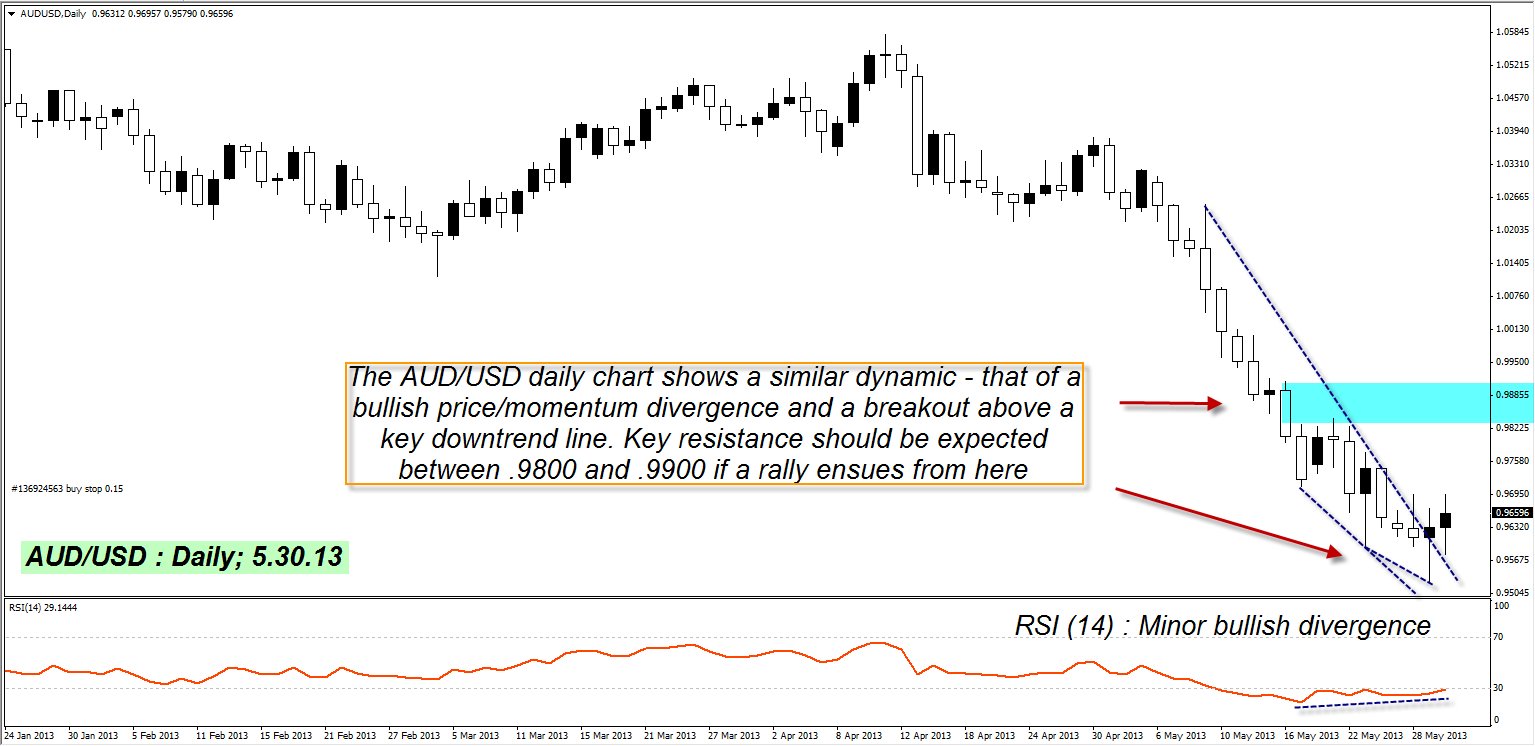
| Figure 2: The daily chart for the AUD/USD shows the same sort of technical dynamics; any sharp rally up toward the blue resistance area should be viewed as a key profit-taking opportunity. |
| Graphic provided by: MetaTrader 4. |
| |
| But for now, let's look at the daily chart for the AUD/USD (Figure 2); the daily chart for the AUD/USD shows a similar set of chart dynamics at work: 1. A break above a major downtrend line 2. A bullish RSI price/momentum divergence setting up. The daily chart gives us a better idea as to the severity of the recent decline, however, and those attempting to go long on a break above .96957 need to have a well thought out strategy, fully prepared to take some profits before the AUD/USD rises (assuming it gets that far in the near-term) much above the .98000 level. After a severe decline like this, markets frequently need to put in a confirmed double bottom pattern before being able to rally again on a long-term basis, so be sure to take some, if not all of your gains on such a successful initial rally up from the recent lows. Traders should also use some sort of trailing stop (like a short-term moving average of the daily lows or a tight volatility trail) to help limit risk; account risk should be kept to a maximum of 1% since this is an above-average reversal-style play. Trade wisely until we meet here again. |
Freelance financial markets writer and online publisher of the Trendzetterz.com S&P 500 Weekly Forecast service.
| Title: | Market consultant and writer |
| Company: | Trendzetterz |
| Address: | 81 Hickory Hollow Drive |
| Crossville, TN 38555 | |
| Phone # for sales: | 904-303-4814 |
| Website: | trendzetterz.com |
| E-mail address: | support@trendzetterz.com |
Traders' Resource Links | |
| Trendzetterz has not added any product or service information to TRADERS' RESOURCE. | |
Click here for more information about our publications!
Comments

|

Request Information From Our Sponsors
- StockCharts.com, Inc.
- Candle Patterns
- Candlestick Charting Explained
- Intermarket Technical Analysis
- John Murphy on Chart Analysis
- John Murphy's Chart Pattern Recognition
- John Murphy's Market Message
- MurphyExplainsMarketAnalysis-Intermarket Analysis
- MurphyExplainsMarketAnalysis-Visual Analysis
- StockCharts.com
- Technical Analysis of the Financial Markets
- The Visual Investor
- VectorVest, Inc.
- Executive Premier Workshop
- One-Day Options Course
- OptionsPro
- Retirement Income Workshop
- Sure-Fire Trading Systems (VectorVest, Inc.)
- Trading as a Business Workshop
- VectorVest 7 EOD
- VectorVest 7 RealTime/IntraDay
- VectorVest AutoTester
- VectorVest Educational Services
- VectorVest OnLine
- VectorVest Options Analyzer
- VectorVest ProGraphics v6.0
- VectorVest ProTrader 7
- VectorVest RealTime Derby Tool
- VectorVest Simulator
- VectorVest Variator
- VectorVest Watchdog
