

HOT TOPICS LIST
- MACD
- Fibonacci
- RSI
- Gann
- ADXR
- Stochastics
- Volume
- Triangles
- Futures
- Cycles
- Volatility
- ZIGZAG
- MESA
- Retracement
- Aroon
INDICATORS LIST
LIST OF TOPICS
PRINT THIS ARTICLE
by Billy Williams
Using a little known method of trend identification can tell you when to enter the market and when to sit on the sidelines.
Position: Buy
Billy Williams
Billy Williams has been trading the markets for 27 years, specializing in momentum trading with stocks and options.
PRINT THIS ARTICLE
TRADING SYSTEMS
Technical Trading With Heiken-Ashi
05/30/13 04:39:04 PMby Billy Williams
Using a little known method of trend identification can tell you when to enter the market and when to sit on the sidelines.
Position: Buy
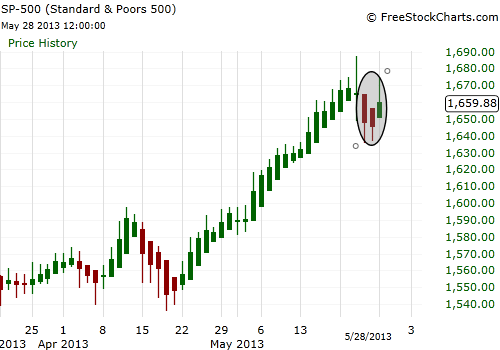
| There can be little doubt that the bulls have had firm control of the market since the beginning of the year with the major indexes in a confirmed uptrend as the month of May is winding down but will the bulls be able to maintain the strength to keep it up as June approaches along with the summer doldrums? It's hard to say with the recent sideways price movement where major indexes like the S&P 500, or SPX, have pulled back somewhat and tried to rally to resume the upward trend, but without much momentum, have stumbled instead. 12 out of the last 20 trading days have been bullish, but recently, price has lacked the follow-through to continue trading upward in a steady succession of higher highs and higher lows in its price movement. This can get a little confusing for technical traders looking to enter into the trend and ride the next wave up and even result in a series of losses as traders enter and then get stopped out as price moves unpredictably, hitting stop losses as it zigzags back and forth. |
|
| Figure 1. The Heiken-Ashi price bars help you confirm if price is in a confirmed trend. Currently the SPX has pulled back and looks to be resuming its upward movement. |
| Graphic provided by: www.freestockcharts.com. |
| |
| But, there is a way to filter out some of the "noise", the erratic gyration of price action, and gain a different point-of-view by using a new set of eyes to watch how things unfold and profit from it. The Heikin-Ashi technique is used by technical traders to identify a given trend more easily. Hollow candles (green on my chart) with no lower shadows are used to signal a strong uptrend, while filled candles (red on my chart) with no higher shadow are used to identify a strong downtrend. |
|
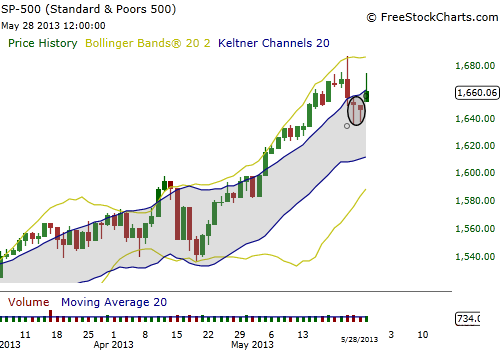
| Figure 2. On the daily chart, you can see price moves a little more unpredictably but using the Heiken-Ashi method to first confirm the trend, can help you make smarter decisions on whether to enter or sit on the sidelines. On this daily chart, price has pulled back and looks to offer a long entry that has also been confirmed on the SPX Heiken-Ashi chart above. |
| Graphic provided by: www.freestockcharts.com. |
| |
| When constructing the chart, Heikin-Ashi is constructed like a regular candlestick chart with the time series defined by the trader on the type of chart desired (hourly, daily, weekly, etc.). Instead of using the open-high-low-close (OHLC) values to create the candlestick, a Heikin-Ashi candlestick will be built with the following formula: HA-Close = (Open+High+Low+Close)/4 HA-Open = [Open(previous bar) + Close(previous bar)]/2 HA-High = Max(High,HA-Open,HA-Close) HA-Low = Min(Low,HA-Open,HA-Close) The down days are represented by filled bars (red on my chart), while the up days are represented by empty bars (green on my chart). The beauty of Heiken-Ashi is that it acts as a setup and a filter, depending on how you want to integrate it with your trading. For example, it can help you filter trends by using the daily Heiken-Ashi to confirm an up or down trend and then the regular daily chart for openings to trade in the direction of that confirmed trend. Or, you can scale down to an hourly chart and try to enter on a pullback and/or consolidation point and ride the large-scale trend for all it's worth. |
| This method of reading charts can give you a means to check the trend as a quick visual reference to help you in your trade decisions without being caught up in the irregular price movement, and help you gain a competitive edge by knowing when to enter a trade and when to sit on the sidelines. |
Billy Williams has been trading the markets for 27 years, specializing in momentum trading with stocks and options.
| Company: | StockOptionSystem.com |
| E-mail address: | stockoptionsystem.com@gmail.com |
Traders' Resource Links | |
| StockOptionSystem.com has not added any product or service information to TRADERS' RESOURCE. | |
Click here for more information about our publications!
Comments

Request Information From Our Sponsors
- StockCharts.com, Inc.
- Candle Patterns
- Candlestick Charting Explained
- Intermarket Technical Analysis
- John Murphy on Chart Analysis
- John Murphy's Chart Pattern Recognition
- John Murphy's Market Message
- MurphyExplainsMarketAnalysis-Intermarket Analysis
- MurphyExplainsMarketAnalysis-Visual Analysis
- StockCharts.com
- Technical Analysis of the Financial Markets
- The Visual Investor
- VectorVest, Inc.
- Executive Premier Workshop
- One-Day Options Course
- OptionsPro
- Retirement Income Workshop
- Sure-Fire Trading Systems (VectorVest, Inc.)
- Trading as a Business Workshop
- VectorVest 7 EOD
- VectorVest 7 RealTime/IntraDay
- VectorVest AutoTester
- VectorVest Educational Services
- VectorVest OnLine
- VectorVest Options Analyzer
- VectorVest ProGraphics v6.0
- VectorVest ProTrader 7
- VectorVest RealTime Derby Tool
- VectorVest Simulator
- VectorVest Variator
- VectorVest Watchdog