HOT TOPICS LIST
- MACD
- Fibonacci
- RSI
- Gann
- ADXR
- Stochastics
- Volume
- Triangles
- Futures
- Cycles
- Volatility
- ZIGZAG
- MESA
- Retracement
- Aroon
INDICATORS LIST
LIST OF TOPICS
PRINT THIS ARTICLE
by Donald W. Pendergast, Jr.
Shares of Bristol Myers Squibb have been on a six month long tear; is a correction soon to appear - or not?
Position: N/A
Donald W. Pendergast, Jr.
Freelance financial markets writer and online publisher of the Trendzetterz.com S&P 500 Weekly Forecast service.
PRINT THIS ARTICLE
KELTNER CHANNELS
BMY: Can This Rally Continue?
05/29/13 02:52:06 PMby Donald W. Pendergast, Jr.
Shares of Bristol Myers Squibb have been on a six month long tear; is a correction soon to appear - or not?
Position: N/A
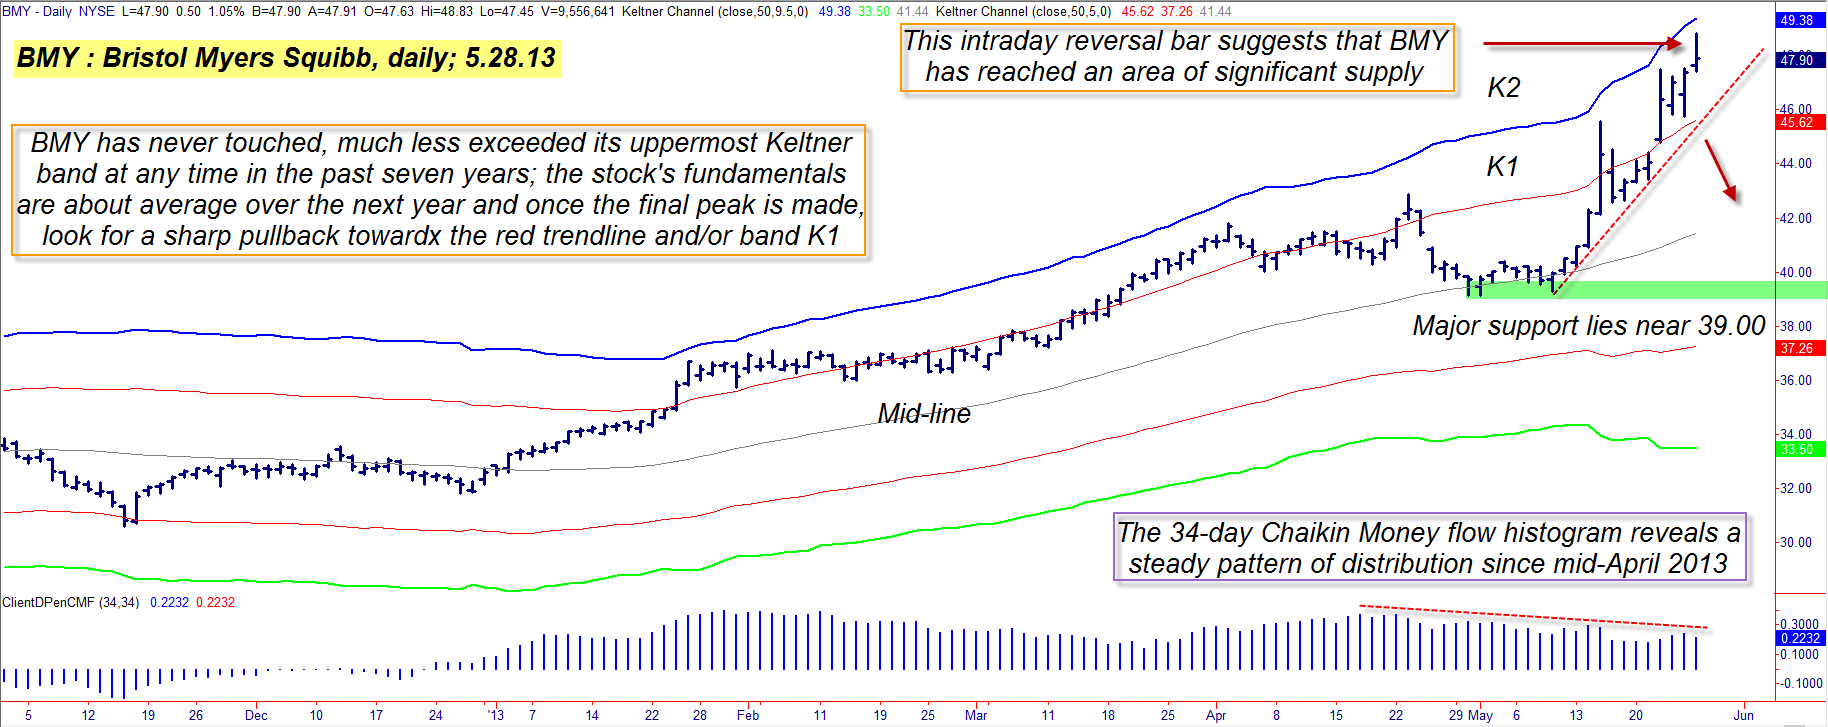
| Bristol Myers Squibb (BMY) is a widely-known "big pharma" name among North American households, and given its strong 58% rally since November 2012, it's also on the minds of traders and investors. Here's a look at BMY's long term uptrend, along with an evaluation of two of its key technical indicators (Figure 1). |

|
| Figure 1. Bristol Myers Squibb shares (BMY) have never touched or exceeded Keltner band K2 at any time during the past seven years; a decline beneath the red uptrend line may lead to a substantial correction. |
| Graphic provided by: TradeStation. |
| |
| BMY completed its last major multicycle low back in mid-November 2012 – along with a great deal of other large cap stocks – and wasted little time in getting back into major rally mode; the stock ran all the way from 30.64 to 48.83 between November 15, 2013, and May 25, 2013, which is a rise of 58.37% in only 6 1/2 months. The most recent phase of BMY's ascent has been marked by a steep angle of attack, with the stock actually starting to approach its extreme upper Keltner band. Clearly, BMY's powerful uptrend cannot be doubted, but an inspection of its medium-term money flow histogram (CMF)(34) reveals that the so-called "smart money" interests in this key healthcare sector issue have been distributing their shares to lesser-informed investors and traders since at least mid-April 2013. That prices keep rising, and in an accelerating manner, should now serve as advance warning of an impending correction in the stock; particularly more so because BMY has never managed to touch that extreme upper Keltner band (set at 9.5 standard deviations away from a 50-period moving average) during the past seven years of trading activity. Unless the stock's underlying fundamentals are outrageously bullish now, there is an extremely high percentage probability that BMY will sputter, cough and correct within the next few weeks. Existing longs in BMY may want to rely on the red uptrend line to guide them as to when to sell their current, long swing trade positions in this stock; speculative, profit-hungry bears might also consider using the same line to initiate the purchase of put options. |

|
| Figure 2: BMY has been significantly outperforming the S&P 500 index (.SPX) over the past 4-, 13-, 26- and 52-week periods. |
| Graphic provided by: TradeStation. |
| Graphic provided by: TradeStation Radar Screen. |
| |
| Several US stock indexes are all still fairly close to their May 2013 all-time highs, with another rally attempt now in progress; if this rally stalls, thus initiating a correction (look for a 4-7% decline in short order once it gets underway), BMY is sure to also be pulled down to lower levels. Option traders might want to look at buying the September '13 BMY $48.00 put if BMY breaks below the red uptrend line, using the Keltner mid-line (near 42.00) as their intermediate term price target; risk no more than 1 to 2% of your account equity on the trade and be sure to take profits if the put either doubles in value or declines in value by 50%. More aggressive traders might also consider the June '13 BMY $47.00 put. By no means get married to this position and consider taking partial profits (thus reducing your overall risk) if the market is generous enough to give you a sudden windfall. The broad US markets could be getting ripe for a proportional correction, so make sure that you have all of your bases covered, no matter what unfolds in the markets over the next month or two. Trade wisely until we meet here again. |
Freelance financial markets writer and online publisher of the Trendzetterz.com S&P 500 Weekly Forecast service.
| Title: | Market consultant and writer |
| Company: | Trendzetterz |
| Address: | 81 Hickory Hollow Drive |
| Crossville, TN 38555 | |
| Phone # for sales: | 904-303-4814 |
| Website: | trendzetterz.com |
| E-mail address: | support@trendzetterz.com |
Traders' Resource Links | |
| Trendzetterz has not added any product or service information to TRADERS' RESOURCE. | |
Click here for more information about our publications!
PRINT THIS ARTICLE

Request Information From Our Sponsors
- VectorVest, Inc.
- Executive Premier Workshop
- One-Day Options Course
- OptionsPro
- Retirement Income Workshop
- Sure-Fire Trading Systems (VectorVest, Inc.)
- Trading as a Business Workshop
- VectorVest 7 EOD
- VectorVest 7 RealTime/IntraDay
- VectorVest AutoTester
- VectorVest Educational Services
- VectorVest OnLine
- VectorVest Options Analyzer
- VectorVest ProGraphics v6.0
- VectorVest ProTrader 7
- VectorVest RealTime Derby Tool
- VectorVest Simulator
- VectorVest Variator
- VectorVest Watchdog
- StockCharts.com, Inc.
- Candle Patterns
- Candlestick Charting Explained
- Intermarket Technical Analysis
- John Murphy on Chart Analysis
- John Murphy's Chart Pattern Recognition
- John Murphy's Market Message
- MurphyExplainsMarketAnalysis-Intermarket Analysis
- MurphyExplainsMarketAnalysis-Visual Analysis
- StockCharts.com
- Technical Analysis of the Financial Markets
- The Visual Investor
