HOT TOPICS LIST
- MACD
- Fibonacci
- RSI
- Gann
- ADXR
- Stochastics
- Volume
- Triangles
- Futures
- Cycles
- Volatility
- ZIGZAG
- MESA
- Retracement
- Aroon
INDICATORS LIST
LIST OF TOPICS
PRINT THIS ARTICLE
by Koos van der Merwe
After a long bear market and last year's devastating earthquake, Japan's economy and market is rising fast.
Position: Sell
Koos van der Merwe
Has been a technical analyst since 1969, and has worked as a futures and options trader with First Financial Futures in Johannesburg, South Africa.
PRINT THIS ARTICLE
ENVELOPES
Another Look At Japan
05/24/13 12:02:41 PMby Koos van der Merwe
After a long bear market and last year's devastating earthquake, Japan's economy and market is rising fast.
Position: Sell
| On December 29, 1989, the Japanese stock market, as measured by the Nikkei-225 hit an all-time intraday high of 38,957.44. Since then it has crashed with the country moving into a recession, and staying in a recession with a bear market that went on for more than 20 years. Why then would you look to invest in Japan? From a low of 8,160 on November 25, 2011, the Nikkei started moving up catching investors attention on the possibility that the Japanese economy could be in recovery. From a negative inflation rate in January, year to year inflation was running at 0.212%. Even wages rose 0.3% that month. To follow the Japan market, I have chosen the Claymore Japan Fundamental Index Fund iShare ETF (CJP) listed on the Toronto market as a share that could give me guidance to Japan's recovery. The ETF looks to replicate, net of expenses, the performance of the FTSE RAFI Japan Canadian Dollar Hedged Index. |

|
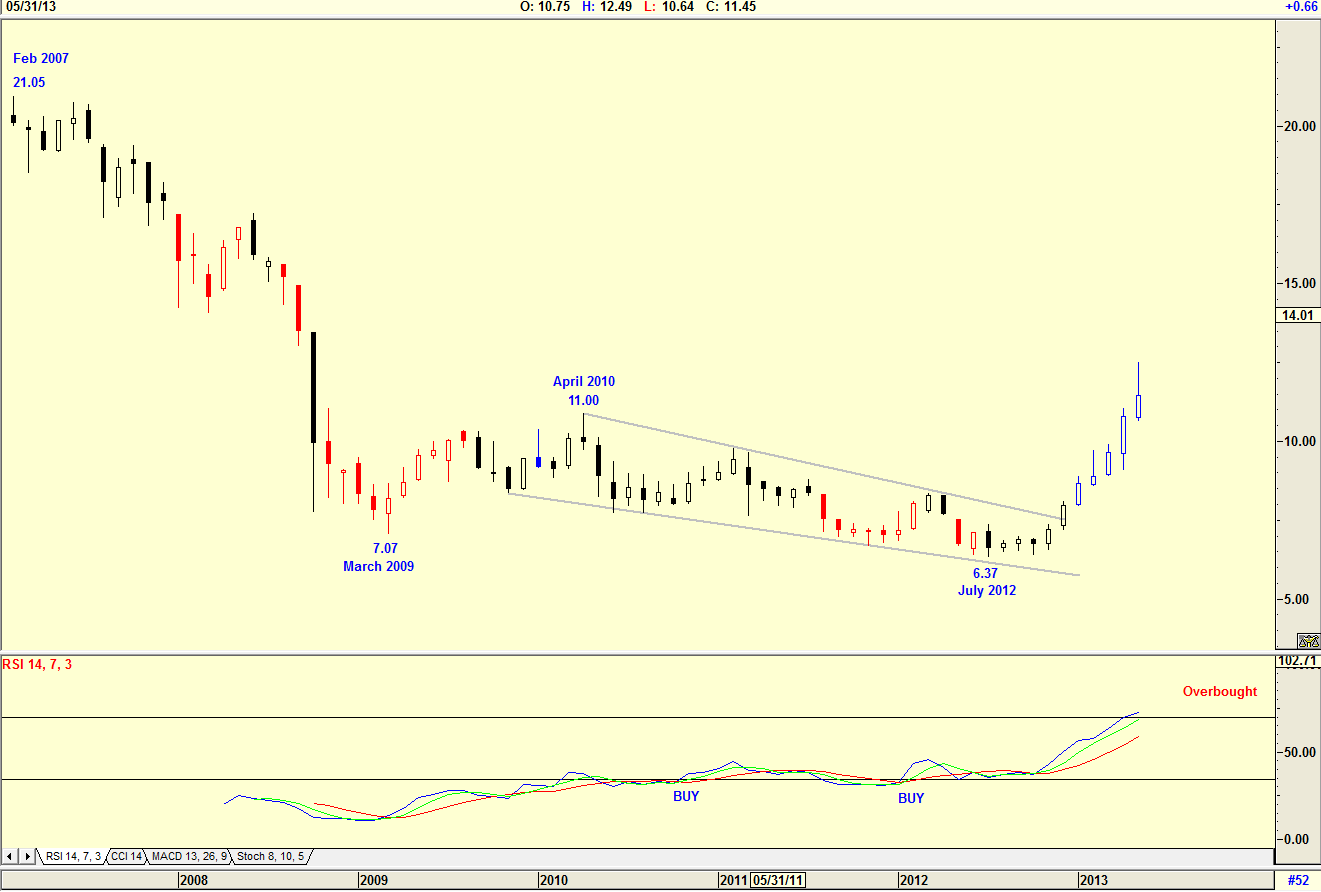
| Figure 1 Monthly Chart |
| Graphic provided by: AdvancedGET. |
| |
| The monthly chart in Figure 1 of CJP shows how the ETF has fallen from a high of $21.05 in February 2007 to a low of $7.07 by March 2009. It then rose to $11.00 by April 2010 but fell to a new low of $6.37 by July 2012. Since then it has been climbing steadily as the world economy appears to be solving its economic problems. The RSI index is, however, at overbought levels which would cause you to hesitate before buying the share as a long-term investment. |

|
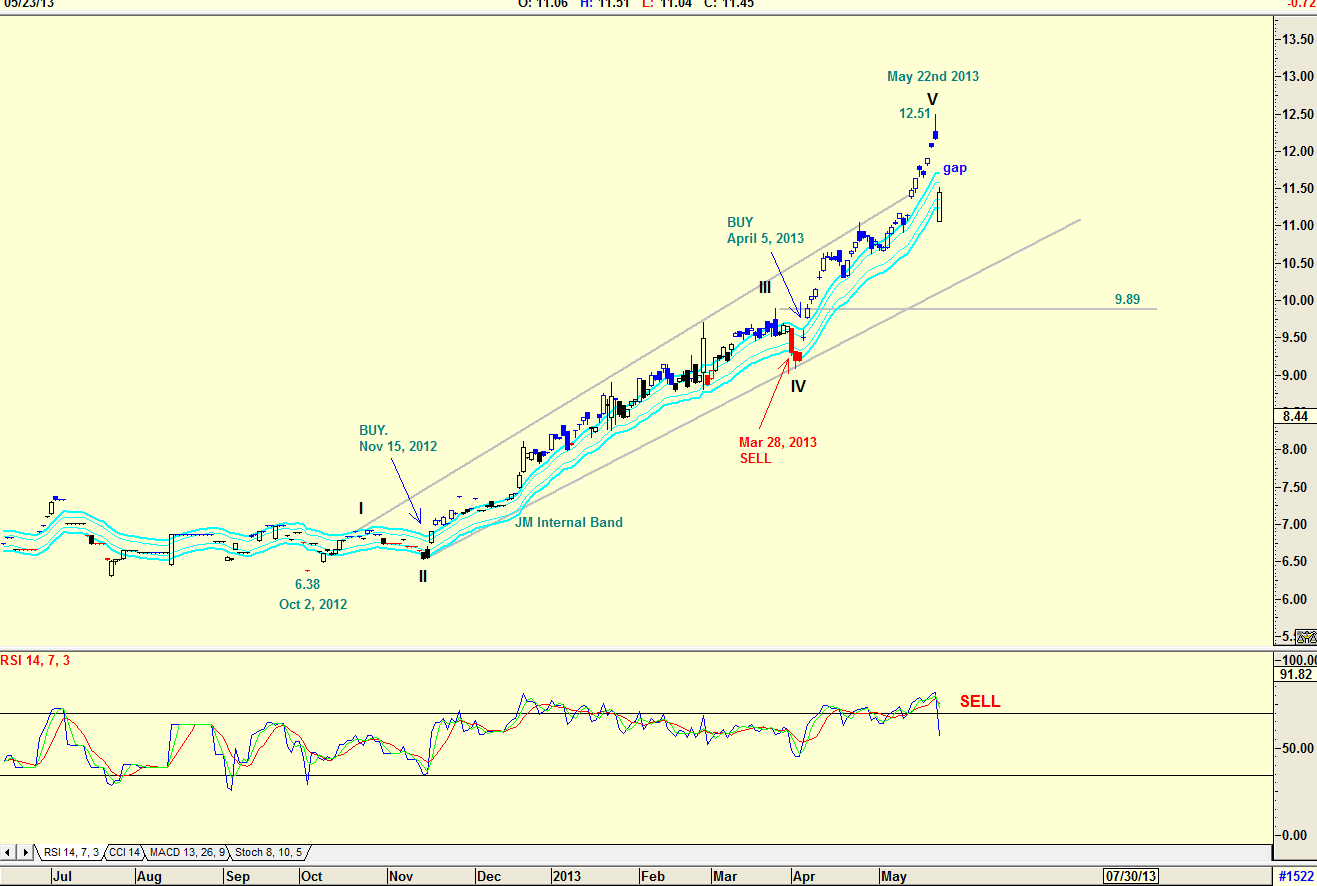
| Figure 2. Daily Chart |
| Graphic provided by: AdvancedGET. |
| |
| Figure 2 is a daily chart, showing how the share price rose from a low of $6.38 on October 2, 2012 to the high of $12.51 by March 22, 2013. The Elliott Wave count shown is a simplified count that suggests a Wave V has been completed, and that the share price should fall in an ABC correction to the $9.89 level. The gap that formed as the share price fell does, however, suggest a rise to fill the gap before a further fall. The RSI index is suggesting weakness having given a sell signal, but looking at its history, it has not been a strong guiding indicator. Looking at the JM Internal Band indicator, we see that a buy signal was given on November 15, 2012. The JM Internal Band indicator is a 15-period simple moving average offset by 2% positive and 2% negative. On March 28, 2013 the JM Internal Band indicator gave a sell signal as the close dropped below the lower band. On April 5, 2013, however, a buy signal was given as the close broke above the upper band. With the fall in price on May 23 at time of writing, the closing price is still above the JM internal Band bottom line, suggesting that you should hold the share until a more definite signal is given. I would not be a buyer of the CJP at present, but I would place the ETF on my watch list keeping an eye of Japan's economic recovery. |
Has been a technical analyst since 1969, and has worked as a futures and options trader with First Financial Futures in Johannesburg, South Africa.
| Address: | 3256 West 24th Ave |
| Vancouver, BC | |
| Phone # for sales: | 6042634214 |
| E-mail address: | petroosp@gmail.com |
Click here for more information about our publications!
PRINT THIS ARTICLE

Request Information From Our Sponsors
- VectorVest, Inc.
- Executive Premier Workshop
- One-Day Options Course
- OptionsPro
- Retirement Income Workshop
- Sure-Fire Trading Systems (VectorVest, Inc.)
- Trading as a Business Workshop
- VectorVest 7 EOD
- VectorVest 7 RealTime/IntraDay
- VectorVest AutoTester
- VectorVest Educational Services
- VectorVest OnLine
- VectorVest Options Analyzer
- VectorVest ProGraphics v6.0
- VectorVest ProTrader 7
- VectorVest RealTime Derby Tool
- VectorVest Simulator
- VectorVest Variator
- VectorVest Watchdog
- StockCharts.com, Inc.
- Candle Patterns
- Candlestick Charting Explained
- Intermarket Technical Analysis
- John Murphy on Chart Analysis
- John Murphy's Chart Pattern Recognition
- John Murphy's Market Message
- MurphyExplainsMarketAnalysis-Intermarket Analysis
- MurphyExplainsMarketAnalysis-Visual Analysis
- StockCharts.com
- Technical Analysis of the Financial Markets
- The Visual Investor
