HOT TOPICS LIST
- MACD
- Fibonacci
- RSI
- Gann
- ADXR
- Stochastics
- Volume
- Triangles
- Futures
- Cycles
- Volatility
- ZIGZAG
- MESA
- Retracement
- Aroon
INDICATORS LIST
LIST OF TOPICS
PRINT THIS ARTICLE
by Billy Williams
The market is in a constant state of motion, trading up and down, but using the VIX you can navigate the turns for low-risk trades with lots of profit potential.
Position: Buy
Billy Williams
Billy Williams has been trading the markets for 27 years, specializing in momentum trading with stocks and options.
PRINT THIS ARTICLE
VOLATILITY
Navigating The Turns With The VIX
05/28/13 04:49:07 PMby Billy Williams
The market is in a constant state of motion, trading up and down, but using the VIX you can navigate the turns for low-risk trades with lots of profit potential.
Position: Buy
| The stock market is in a constant state of flux where one moment it seems that the market is going up and the next minute it's trading down, which leaves traders confused on how to navigate market turns. Every trader knows the old maxim of "buying on dips" or "buying low and selling high" but in the thick of the action, your emotions can sometimes sabotage your pursuit of above-average returns. This results in most traders choking and failing to act when the market begins to move fast causing them to end up on the sidelines. This failure to act can end up costing traders dearly over the long run. A 2011 study from DALBAR, a Boston-based research firm, shows that stock investors achieved a meager 3.8% annual return from December 31, 1990 to December 31, 2010 versus the 9.1% annual average return of the S&P 500. Over that 20 year period, investors hurt themselves by jumping in and out of the market at the absolute worst moment. Fear and greed worked against them by paralyzing them to act when they should have acted in spite of their emotions. |

|
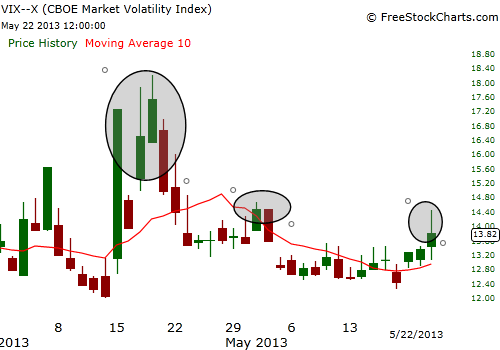
| Figure 1: In each of these highlighted areas, the VIX traded well beyond its 10-day SMA signalling extreme levels of fear in the market and the likelihood that volatility would revert to its mean and price would snap-back to the upside. |
| Graphic provided by: www.freestockcharts.com. |
| |
| Emotions can work against you if you trade with no plan or strategy to capitalize on the days in the market that offer you the best chance for high returns. Worse, they could have you trading on the wrong side of the market and at the worst possible time. This is why it's easy to feel as if the odds are stacked against you but is tied to the lack of having a set of rules or system to signal when to act and when to step aside. Fortunately, there is a way to time your entries at the optimal time and help remove your emotions out of the decision-making process. |

|
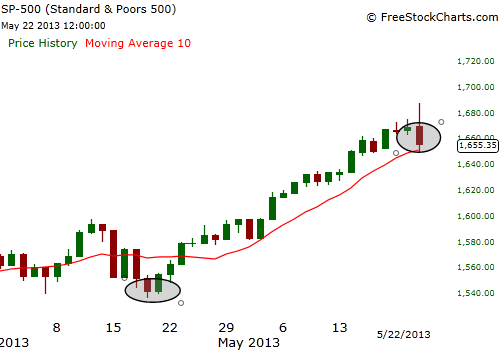
| Figure 2: In the S&P, each extreme level in the VIX corresponded with a snap-back in upwards price movement and offering traders a low-risk entry and great profit potential too. |
| Graphic provided by: www.freestockcharts.com. |
| |
| The Chicago Board Options Exchange (CBOE) volatility index, or VIX, shows the market's expectation of 30-day volatility. It is constructed using the implied volatilities of a wide range of S&P 500 index options. This volatility is meant to be forward looking and is calculated from both calls and puts. The VIX is a widely used measure of market risk and is often referred to as the "fear gauge." The underlying concept is that most investors and traders act out of fear and greed at the wrong time and that drives the price of the market to extremes. By using the VIX, you can see where traders experience the greatest amount of fear as the market is selling off and use that edge to time the market. |
| Using a simple 10-day SMA over the VIX's price action, watch for trading days where the S&P 500 sells off to an extreme price level and where the VIX rises 10% over its 10-day SMA. It is at those inflection points where price is likely to reverse and signal a turn in the market back to the upside. This helps you time where the scared money has dumped their position and where the bulls are likely to step back in and push the market higher. You can use the SPY or futures to trade the S&P or use options in the form of calls or any credit spread to catch low-risk moves from the VIX's reversal signal back to the upside. |
Billy Williams has been trading the markets for 27 years, specializing in momentum trading with stocks and options.
| Company: | StockOptionSystem.com |
| E-mail address: | stockoptionsystem.com@gmail.com |
Traders' Resource Links | |
| StockOptionSystem.com has not added any product or service information to TRADERS' RESOURCE. | |
Click here for more information about our publications!
Comments

Request Information From Our Sponsors
- StockCharts.com, Inc.
- Candle Patterns
- Candlestick Charting Explained
- Intermarket Technical Analysis
- John Murphy on Chart Analysis
- John Murphy's Chart Pattern Recognition
- John Murphy's Market Message
- MurphyExplainsMarketAnalysis-Intermarket Analysis
- MurphyExplainsMarketAnalysis-Visual Analysis
- StockCharts.com
- Technical Analysis of the Financial Markets
- The Visual Investor
- VectorVest, Inc.
- Executive Premier Workshop
- One-Day Options Course
- OptionsPro
- Retirement Income Workshop
- Sure-Fire Trading Systems (VectorVest, Inc.)
- Trading as a Business Workshop
- VectorVest 7 EOD
- VectorVest 7 RealTime/IntraDay
- VectorVest AutoTester
- VectorVest Educational Services
- VectorVest OnLine
- VectorVest Options Analyzer
- VectorVest ProGraphics v6.0
- VectorVest ProTrader 7
- VectorVest RealTime Derby Tool
- VectorVest Simulator
- VectorVest Variator
- VectorVest Watchdog
