HOT TOPICS LIST
- MACD
- Fibonacci
- RSI
- Gann
- ADXR
- Stochastics
- Volume
- Triangles
- Futures
- Cycles
- Volatility
- ZIGZAG
- MESA
- Retracement
- Aroon
INDICATORS LIST
LIST OF TOPICS
PRINT THIS ARTICLE
by Koos van der Merwe
Abbott Laboratories (ABT) generates the highest percentage of its revenue through pharmaceuticals, at around 62%.
Position: Buy
Koos van der Merwe
Has been a technical analyst since 1969, and has worked as a futures and options trader with First Financial Futures in Johannesburg, South Africa.
PRINT THIS ARTICLE
CHART ANALYSIS
Abbott Laboratories
05/22/13 03:14:39 PMby Koos van der Merwe
Abbott Laboratories (ABT) generates the highest percentage of its revenue through pharmaceuticals, at around 62%.
Position: Buy
| Abbott Laboratories (ABT) got a bit of a bump on Monday after a couple of Wall Street analysts declared their affection for the company's shares and praised the pharmaceutical firm and medical supplier for diversifying in an increasingly competitive climate wrought by generic drugs. Goldman Sachs analyst David Roman upped his rating on the stock to buy from neutral and raised his 12-month price target to $44 a share. |

|
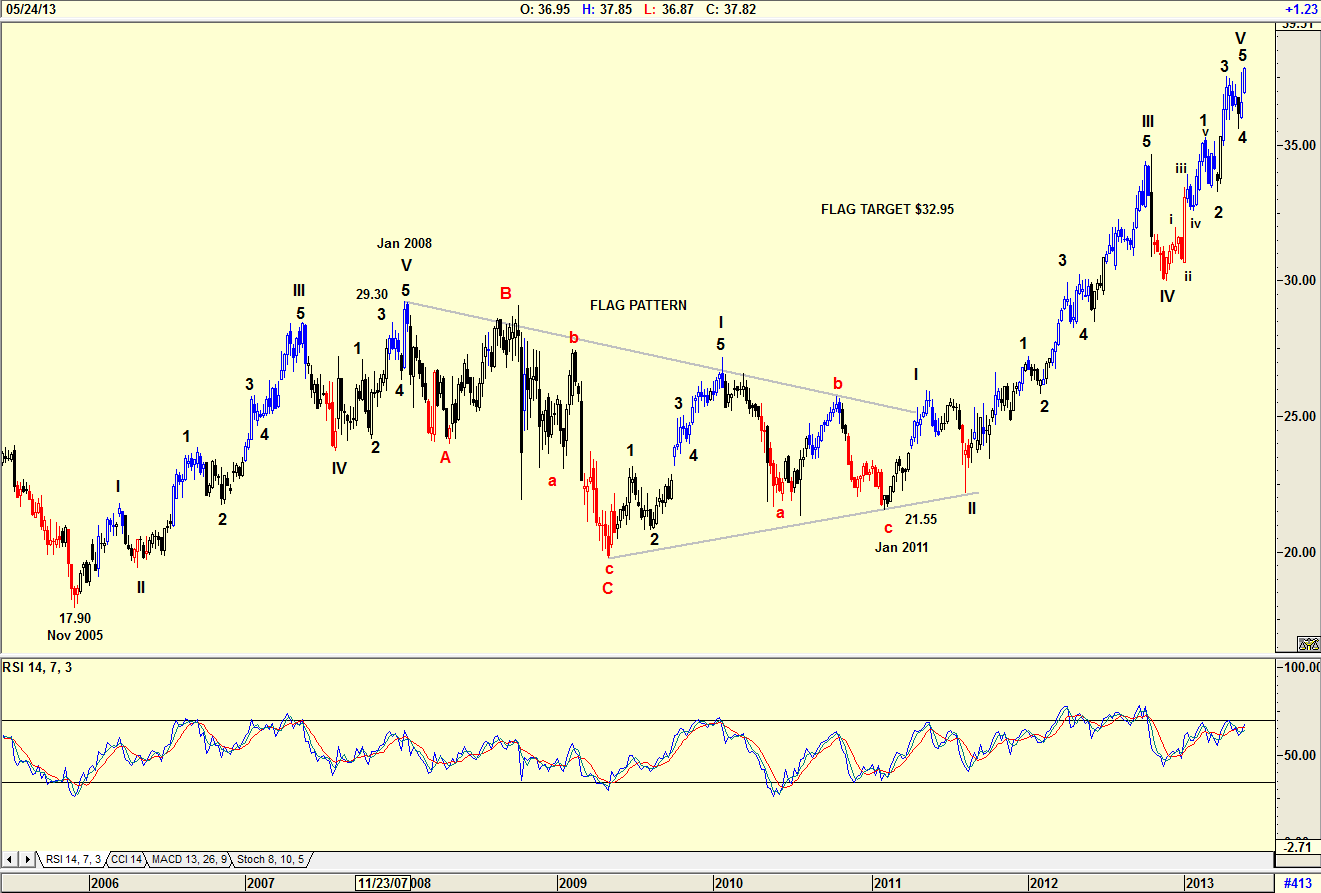
| Figure 1. Weekly chart of Abbott Labs with Elliott wave count. |
| Graphic provided by: AdvancedGET. |
| |
| The chart in Figure 1 is a weekly chart with an Elliott Wave count that is suggesting that the share price could be topping out in a WAVE V. The RSI indicator is not confirming this, suggesting that the share price could rise further. Looking at the flag pattern shown, the target suggested is $32.95. (29.30-17.90=11.90+21.55=32.95). With the share price presently higher than $32.95 we could expect a correction in the near future. |

|
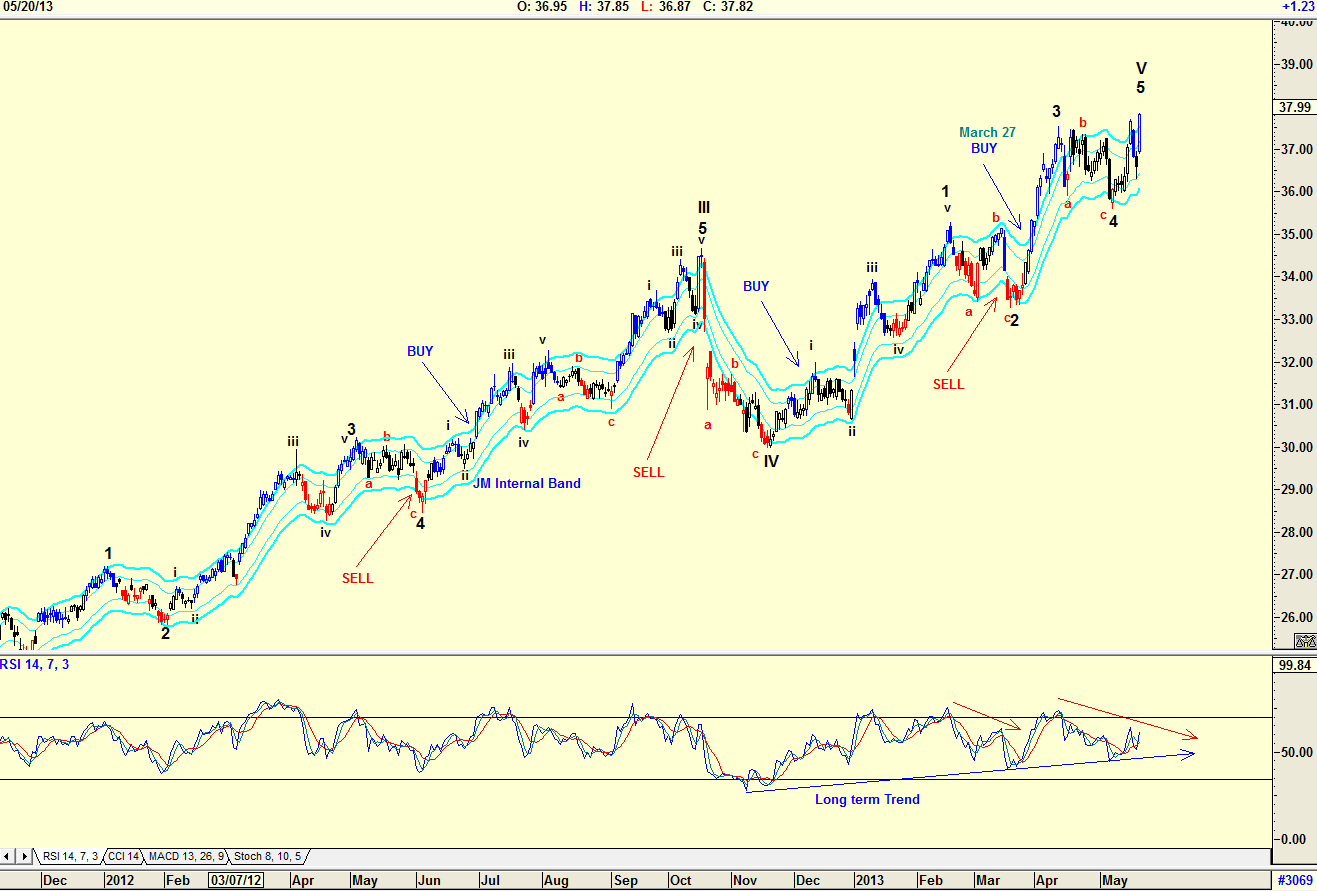
| Figure 2. Daily Chart showing JM Internal Band. |
| Graphic provided by: AdvancedGET. |
| |
| The daily chart in Figure 2 shows a buy signal given by the JM Internal Band indicator on March 27, 2013. The JM Internal Band indicator is a 15-period simple moving average offset by 2% positive and 2% negative. The RSI indicator is suggesting strength as shown by the blue arrow support line even though the trend suggested by the red arrows is suggesting negativity. I would be a buyer of ABT at present levels but for trading only with short stops. Investors should wait for the major ABC correction which looks as though it could happen at any time. |
Has been a technical analyst since 1969, and has worked as a futures and options trader with First Financial Futures in Johannesburg, South Africa.
| Address: | 3256 West 24th Ave |
| Vancouver, BC | |
| Phone # for sales: | 6042634214 |
| E-mail address: | petroosp@gmail.com |
Click here for more information about our publications!
Comments

Request Information From Our Sponsors
- StockCharts.com, Inc.
- Candle Patterns
- Candlestick Charting Explained
- Intermarket Technical Analysis
- John Murphy on Chart Analysis
- John Murphy's Chart Pattern Recognition
- John Murphy's Market Message
- MurphyExplainsMarketAnalysis-Intermarket Analysis
- MurphyExplainsMarketAnalysis-Visual Analysis
- StockCharts.com
- Technical Analysis of the Financial Markets
- The Visual Investor
- VectorVest, Inc.
- Executive Premier Workshop
- One-Day Options Course
- OptionsPro
- Retirement Income Workshop
- Sure-Fire Trading Systems (VectorVest, Inc.)
- Trading as a Business Workshop
- VectorVest 7 EOD
- VectorVest 7 RealTime/IntraDay
- VectorVest AutoTester
- VectorVest Educational Services
- VectorVest OnLine
- VectorVest Options Analyzer
- VectorVest ProGraphics v6.0
- VectorVest ProTrader 7
- VectorVest RealTime Derby Tool
- VectorVest Simulator
- VectorVest Variator
- VectorVest Watchdog
