HOT TOPICS LIST
- MACD
- Fibonacci
- RSI
- Gann
- ADXR
- Stochastics
- Volume
- Triangles
- Futures
- Cycles
- Volatility
- ZIGZAG
- MESA
- Retracement
- Aroon
INDICATORS LIST
LIST OF TOPICS
PRINT THIS ARTICLE
by Gary Grosschadl
Previous articles have shown a good correlation between VIX and the main indices -- especially Nasdaq. There is an inverse relationship here as VIX runs opposite to the indices.
Position: N/A
Gary Grosschadl
Independent Canadian equities trader and technical analyst based in Peterborough
Ontario, Canada.
PRINT THIS ARTICLE
CHART ANALYSIS
VIX Shows Bull (Bear Rally?) May Tire Soon
08/23/02 11:01:43 AMby Gary Grosschadl
Previous articles have shown a good correlation between VIX and the main indices -- especially Nasdaq. There is an inverse relationship here as VIX runs opposite to the indices.
Position: N/A
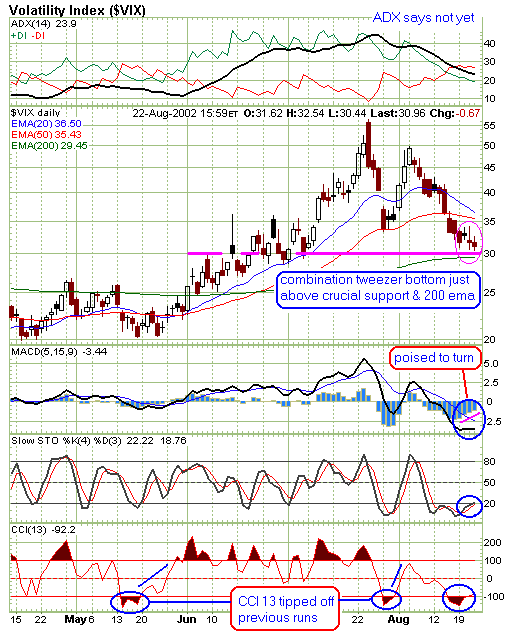
| The current chart of VIX suggests that it may have reached a crucial support level and could soon reverse direction, indicating that the rally of the main indices could reverse. |
| Tweezers, a candlestick formation so called because they resemble prongs, are defined as two or more candlesticks with matching highs or lows. These can be consecutive or nearby as the group of three on the chart below illustrates. They are more relevent and have extra importance after extended moves. In this case they also occur near crucial 200-day EMA support and at a likely strong previous resistance level, making this a likely strong support level. |

|
| Graphic provided by: stockcharts.com. |
| |
| The displayed MACD indicator shows a potential turn as it looks very oversold. Even more suggestive is the CCI (commodity channel index - an oscillator used to identify changes and strength in trend). Note how well it foretold a reversal once it moved above oversold territory. |
| I would expect some hefty resistance between here and Nasdaq's weekly 20-day EMA resistance at 1488. A balk near that level with a VIX move above the 35 resistance level could mark yet another reversal in these volatile times. Likewise a VIX move below the 200-day EMA and a Nasdaq move above 1488-1500 would be a very bullish signal negating the previous bearish tone. As always, time will tell soon enough. |
Independent Canadian equities trader and technical analyst based in Peterborough
Ontario, Canada.
| Website: | www.whatsonsale.ca/financial.html |
| E-mail address: | gwg7@sympatico.ca |
Click here for more information about our publications!
Comments
Date: 08/24/02Rank: 4Comment:
Date: 08/26/02Rank: 5Comment:
Date: 08/27/02Rank: 3Comment: Hi Gary,
vix is almost a mirrored image of
major indices such as S P500. what
would be advantage of studying vix
over those indices?
thanks,
Eric
Date: 08/27/02Rank: 2Comment:
Date: 09/10/02Rank: 5Comment:

|

Request Information From Our Sponsors
- StockCharts.com, Inc.
- Candle Patterns
- Candlestick Charting Explained
- Intermarket Technical Analysis
- John Murphy on Chart Analysis
- John Murphy's Chart Pattern Recognition
- John Murphy's Market Message
- MurphyExplainsMarketAnalysis-Intermarket Analysis
- MurphyExplainsMarketAnalysis-Visual Analysis
- StockCharts.com
- Technical Analysis of the Financial Markets
- The Visual Investor
- VectorVest, Inc.
- Executive Premier Workshop
- One-Day Options Course
- OptionsPro
- Retirement Income Workshop
- Sure-Fire Trading Systems (VectorVest, Inc.)
- Trading as a Business Workshop
- VectorVest 7 EOD
- VectorVest 7 RealTime/IntraDay
- VectorVest AutoTester
- VectorVest Educational Services
- VectorVest OnLine
- VectorVest Options Analyzer
- VectorVest ProGraphics v6.0
- VectorVest ProTrader 7
- VectorVest RealTime Derby Tool
- VectorVest Simulator
- VectorVest Variator
- VectorVest Watchdog
