

HOT TOPICS LIST
- MACD
- Fibonacci
- RSI
- Gann
- ADXR
- Stochastics
- Volume
- Triangles
- Futures
- Cycles
- Volatility
- ZIGZAG
- MESA
- Retracement
- Aroon
INDICATORS LIST
LIST OF TOPICS
PRINT THIS ARTICLE
by Donald W. Pendergast, Jr.
Shares of FMC Technologies (FTI) continue to soar ever higher; is this a time to be a buyer, or should traders wait for a correction first?
Position: N/A
Donald W. Pendergast, Jr.
Freelance financial markets writer and online publisher of the Trendzetterz.com S&P 500 Weekly Forecast service.
PRINT THIS ARTICLE
NEW HIGHS-NEW LOWS
FTI: Multiyear High And Strong Money Flows
05/22/13 03:11:13 PMby Donald W. Pendergast, Jr.
Shares of FMC Technologies (FTI) continue to soar ever higher; is this a time to be a buyer, or should traders wait for a correction first?
Position: N/A
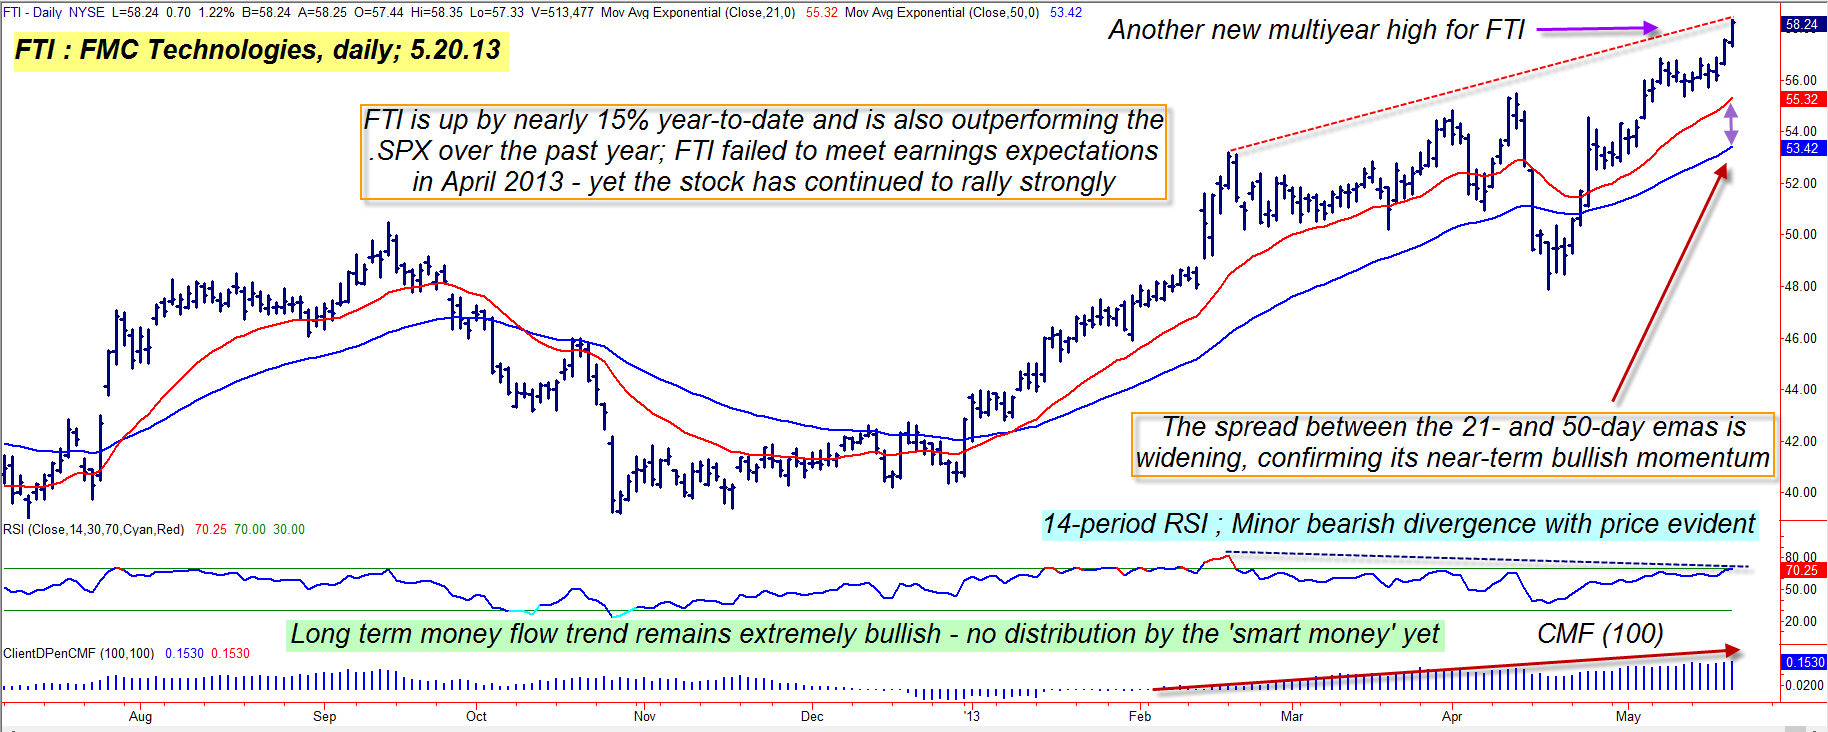
| FMC Technologies common stock (FTI) has rallied by more than 49% since late October 2012 and is once again trading at a new all-time high (Figure 1). If you look at a 10-year weekly chart of the stock, you'll also learn that FTI has amassed gains of 1,070% since May 2003 and that its long-term uptrend pattern of higher swing highs and higher swing lows is still very bullish. Here's a look at a near-term covered call play, one intended to capitalize on FTI's powerful bullish momentum. |
|
| Figure 1: With FTI continuing to make new all-time highs, now might seem an illogical time to put on a long trade but the June '13 $55.00 covered call looks like a low risk way to profit from further potential near-term gains. |
| Graphic provided by: TradeStation. |
| |
| To some traders and investors, the thought of buying a stock that has just made a new multiyear high is very unsettling; after all, traders have continuously heard the old Wall Street adage of "buy low, sell high" and then routinely try to follow that bit of advice by trying to buy at the bottom of a pullback and sell when their favorite technical oscillator goes into "overbought" territory. And while that kind of trading strategy is fine — if it's based on a statistically valid, thoroughly back-tested set of entry, exit, and position-sizing variables — sometimes the pathway to even larger trading gains is located by following the seemingly counter-intuitive trading logic stated as "buy high, sell higher." With this style of trading, the big idea is to find stocks that have terrific bullish momentum and that are already in the midst of powerful long-term trends; traders beholden to this type of strategy typically look for bullish moving average crossovers (such as a three-period EMA crossing above a six-period EMA), channel breakouts (such as the Turtles 21-day or 55-day breakout methods) a high comparative relative strength ranking versus the .SPX over a four- or 13-week period or even a 14-period ADX reading that crosses above a level of 25 or 30. If such bullish price action occurs on a daily chart even as a weekly chart is confirming a series of higher swing highs and higher swing lows, such traders have little problem entering new long positions — even though prices may have already risen several percent above the "ideal" pullback low entry price. Of course, they still need to have tested and fine-tuned these kinds of "buy on strength" systems before actually deploying them in the markets with real trading capital, but still, it's amazing that such simple systems still work so well today in this age of algorithmic, high-frequency trading. Price trends tend to persist — sometimes for far longer than the "overbought, oversold" crowd would care to acknowledge — and therefore "buy high, sell higher" is a good, logical way to trade the markets as part of a well developed overall trading agenda. Now that you understand the basic difference between these two styles of trading, here's a look at a simple covered call strategy for FTI that also seeks to buy into strength, looking to gain a modest near-term profit with modest risk. |
|
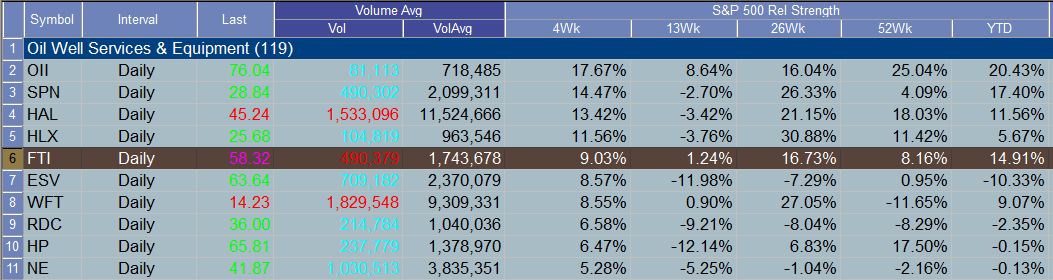
| Figure 2: FTI is easily outperforming the S&P 500 index (.SPX) across a wide variety of time periods. |
| Graphic provided by: TradeStation. |
| Graphic provided by: TradeStation Radar Screen. |
| |
| The covered call play goes something like this: Buy 100 shares of FTI at market (currently trading at 58.62) and then immediately sell one June '13 FTI $55.00 call option at market (currently selling for 4.10 or $410 before commissions and slippage). The call option expires at the close on Friday, June 21, 2013 — a little more than four weeks from now — and as long as FTI closes at 55.01 or above, the stock will be called away, netting a profit of approximately $48 per covered call at expiration. That's an annualized return of about 10%, which is about ten to twelve times the rate of return on a typical FDIC-insured money market savings account. To manage the position, simply use the red 21-day exponential moving average (EMA) as a daily-based trailing stop for the life of the trade; if FTI closes below the EMA, liquidate the entire position and stay in cash with the proceeds until another low risk trade opportunity appears. Unless FTI makes an unusually large daily gap down below the EMA, the risk of loss on this trade remains modest. But since the entire broad market has rallied so strongly since mid-April, try to keep your maximum account risk on this CC play at about 1% of your account value. As always, trade wisely until we meet here again. |
Freelance financial markets writer and online publisher of the Trendzetterz.com S&P 500 Weekly Forecast service.
| Title: | Market consultant and writer |
| Company: | Trendzetterz |
| Address: | 81 Hickory Hollow Drive |
| Crossville, TN 38555 | |
| Phone # for sales: | 904-303-4814 |
| Website: | trendzetterz.com |
| E-mail address: | support@trendzetterz.com |
Traders' Resource Links | |
| Trendzetterz has not added any product or service information to TRADERS' RESOURCE. | |
Click here for more information about our publications!
Comments

Request Information From Our Sponsors
- VectorVest, Inc.
- Executive Premier Workshop
- One-Day Options Course
- OptionsPro
- Retirement Income Workshop
- Sure-Fire Trading Systems (VectorVest, Inc.)
- Trading as a Business Workshop
- VectorVest 7 EOD
- VectorVest 7 RealTime/IntraDay
- VectorVest AutoTester
- VectorVest Educational Services
- VectorVest OnLine
- VectorVest Options Analyzer
- VectorVest ProGraphics v6.0
- VectorVest ProTrader 7
- VectorVest RealTime Derby Tool
- VectorVest Simulator
- VectorVest Variator
- VectorVest Watchdog
- StockCharts.com, Inc.
- Candle Patterns
- Candlestick Charting Explained
- Intermarket Technical Analysis
- John Murphy on Chart Analysis
- John Murphy's Chart Pattern Recognition
- John Murphy's Market Message
- MurphyExplainsMarketAnalysis-Intermarket Analysis
- MurphyExplainsMarketAnalysis-Visual Analysis
- StockCharts.com
- Technical Analysis of the Financial Markets
- The Visual Investor