

HOT TOPICS LIST
- MACD
- Fibonacci
- RSI
- Gann
- ADXR
- Stochastics
- Volume
- Triangles
- Futures
- Cycles
- Volatility
- ZIGZAG
- MESA
- Retracement
- Aroon
INDICATORS LIST
LIST OF TOPICS
PRINT THIS ARTICLE
by Donald W. Pendergast, Jr.
Currently trading at a two-year high, shares of Morgan Stanley are becoming increasingly vulnerable to a correction.
Position: N/A
Donald W. Pendergast, Jr.
Freelance financial markets writer and online publisher of the Trendzetterz.com S&P 500 Weekly Forecast service.
PRINT THIS ARTICLE
RSI
Morgan Stanley: Correction Probabilities Increase
05/21/13 04:05:28 PMby Donald W. Pendergast, Jr.
Currently trading at a two-year high, shares of Morgan Stanley are becoming increasingly vulnerable to a correction.
Position: N/A
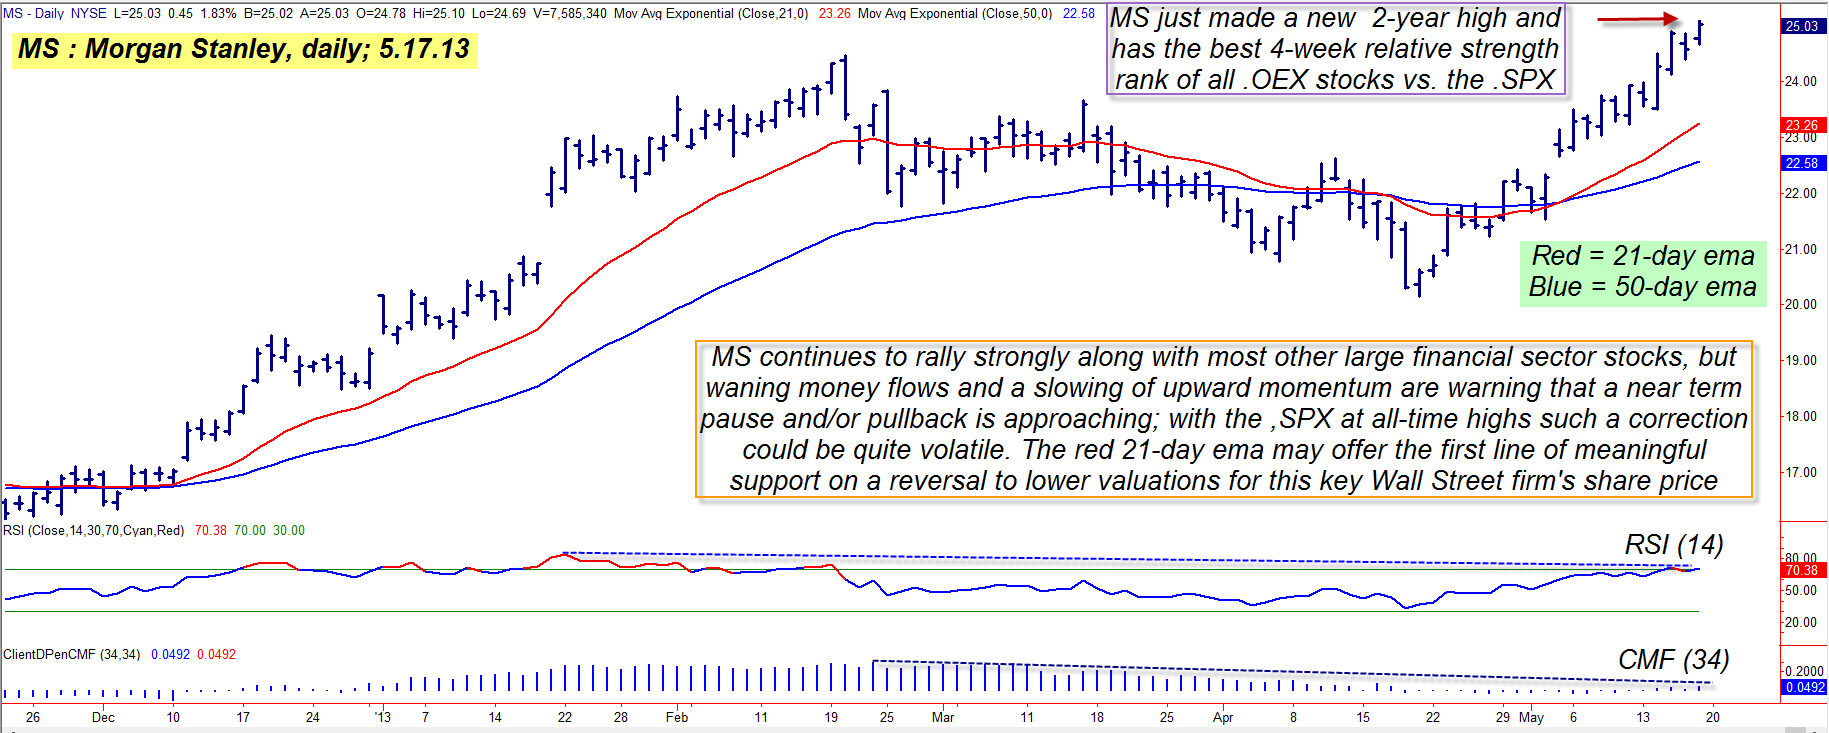
| Morgan Stanley (MS) shares have taken it on the chin twice over the past six years; the first selloff was the most devastating — when it plunged from its June 2007 highs of 75.50 to its doom-and-gloom crater price of 6.71 only 16 months later in October 2008. That was a full 91% decline for MS, a revaluation that few, if any, financial sector stock traders will ever likely forget. MS took another hit during the Euro zone crisis of 2011. This time the decline was milder but still quite deep — a full 63% drop between February and October 2011. That particular decline set the stage for MS to form an important double bottom pattern, one that was confirmed between June/July 2012, and since then MS has rallied by 104% and also managed to set a new two-year high to boot. Long term, the stock appears to be in the early stages of what could morph into a major multiyear rally, but in the weeks just ahead, MS is very likely to correct some of its recent gains. Here's a closer look (Figure 1). |
|
| Figure 1: Morgan Stanley's weekly chart uptrend is still very bullish but on the daily time frame, MS appears to be losing major steam in terms of money flow trend and upward momentum. |
| Graphic provided by: TradeStation. |
| |
| Since late February 2013, Morgan Stanley's 14-day RSI indicator has failed to make a new high, even as the price of the stock has continued to accelerate higher out of its recent April 2013 swing low; this slowing of upward momentum is a strong clue that warns of declining buying interest by institutional investors, coupled with the fact that the stock's 34-day Chaikin Money flow (CMF)(34) trend has turned decidedly bearish, and in a big way. The "smart money" are clearly in distribution mode in MS &mdsash; at least for the near-term — and that means that MS is probably going to start to correct soon. The most probable initial pullback target is the red 21-day exponential moving average (EMA), currently near 23.30, and if MS declines below 24.42 (in conjunction with a broad market selloff), it likely will not take too long for MS to shed a full dollar in price within a few trading sessions. Existing swing trader longs in MS should be using a trailing stop (such as a daily chart trend line or a 9- to 21-day EMA) to help lock in any gains accumulated over the past month; long term position traders should also be considering buying some put option protection, too. Again, MS has a bullish weekly uptrend in place, so you don't necessarily need to be preparing for a full blown trend reversal here, but a near-term correction back to its 21- or 50-day EMA looks like it's going to happen by late May or early June 2013. |
|
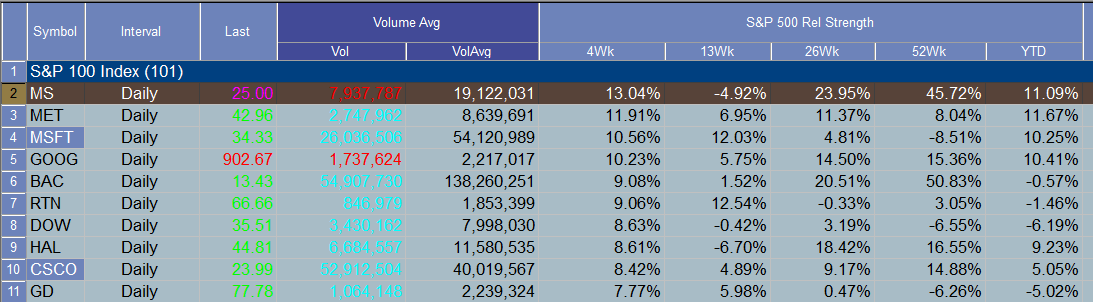
| Figure 2: Morgan Stanley (MS) is substantially outperforming the S&P 500 index (.SPX) over the last 4-, 26-and 52-week periods. Financial sector stocks continue to push the .SPX higher, but expect a pullback within the next week or so. |
| Graphic provided by: TradeStation. |
| Graphic provided by: TradeStation Radar Screen. |
| |
| Speculative put traders might consider buying the July '13 MS $25.00 put as follows: 1. Between now and Friday May 24, 2013, look for MS to drop below 24.42, then buy the put; the bid/ask spread is only a penny, it has a full two months until expiration and open interest is currently more than 3,600 contracts. 2. The price target is the red 21-day EMA; if MS hits that line, sell the put for a profit, without delay. 3. Maintain a 50% option stop loss for the life of the trade; if stopped out just wait for a better trade setup to come along. As with most "reversal" type trade setups, the risk on this one should also be kept to a maximum of 1% of your account value. Overall, this should be a low risk play (if it triggers by May 24), one that may also have the power of a broad market reversal helping push it into the win column. As always, trade wisely until we meet here again. |
Freelance financial markets writer and online publisher of the Trendzetterz.com S&P 500 Weekly Forecast service.
| Title: | Market consultant and writer |
| Company: | Trendzetterz |
| Address: | 81 Hickory Hollow Drive |
| Crossville, TN 38555 | |
| Phone # for sales: | 904-303-4814 |
| Website: | trendzetterz.com |
| E-mail address: | support@trendzetterz.com |
Traders' Resource Links | |
| Trendzetterz has not added any product or service information to TRADERS' RESOURCE. | |
Click here for more information about our publications!
Comments

Request Information From Our Sponsors
- StockCharts.com, Inc.
- Candle Patterns
- Candlestick Charting Explained
- Intermarket Technical Analysis
- John Murphy on Chart Analysis
- John Murphy's Chart Pattern Recognition
- John Murphy's Market Message
- MurphyExplainsMarketAnalysis-Intermarket Analysis
- MurphyExplainsMarketAnalysis-Visual Analysis
- StockCharts.com
- Technical Analysis of the Financial Markets
- The Visual Investor
- VectorVest, Inc.
- Executive Premier Workshop
- One-Day Options Course
- OptionsPro
- Retirement Income Workshop
- Sure-Fire Trading Systems (VectorVest, Inc.)
- Trading as a Business Workshop
- VectorVest 7 EOD
- VectorVest 7 RealTime/IntraDay
- VectorVest AutoTester
- VectorVest Educational Services
- VectorVest OnLine
- VectorVest Options Analyzer
- VectorVest ProGraphics v6.0
- VectorVest ProTrader 7
- VectorVest RealTime Derby Tool
- VectorVest Simulator
- VectorVest Variator
- VectorVest Watchdog