HOT TOPICS LIST
- MACD
- Fibonacci
- RSI
- Gann
- ADXR
- Stochastics
- Volume
- Triangles
- Futures
- Cycles
- Volatility
- ZIGZAG
- MESA
- Retracement
- Aroon
INDICATORS LIST
LIST OF TOPICS
PRINT THIS ARTICLE
by Koos van der Merwe
Is Apple going to give us another bite in the near future?
Position: Accumulate
Koos van der Merwe
Has been a technical analyst since 1969, and has worked as a futures and options trader with First Financial Futures in Johannesburg, South Africa.
PRINT THIS ARTICLE
ELLIOTT WAVE
Another Look At Apple, Inc.
05/21/13 03:52:56 PMby Koos van der Merwe
Is Apple going to give us another bite in the near future?
Position: Accumulate
| Many analysts are saying that the company, Apple, Inc. (AAPL) has lost its innovation under the management of Tim Cook. The share price of AAPL has fallen dramatically because of this impression. If this is true, then why are the charts suggesting otherwise? |

|
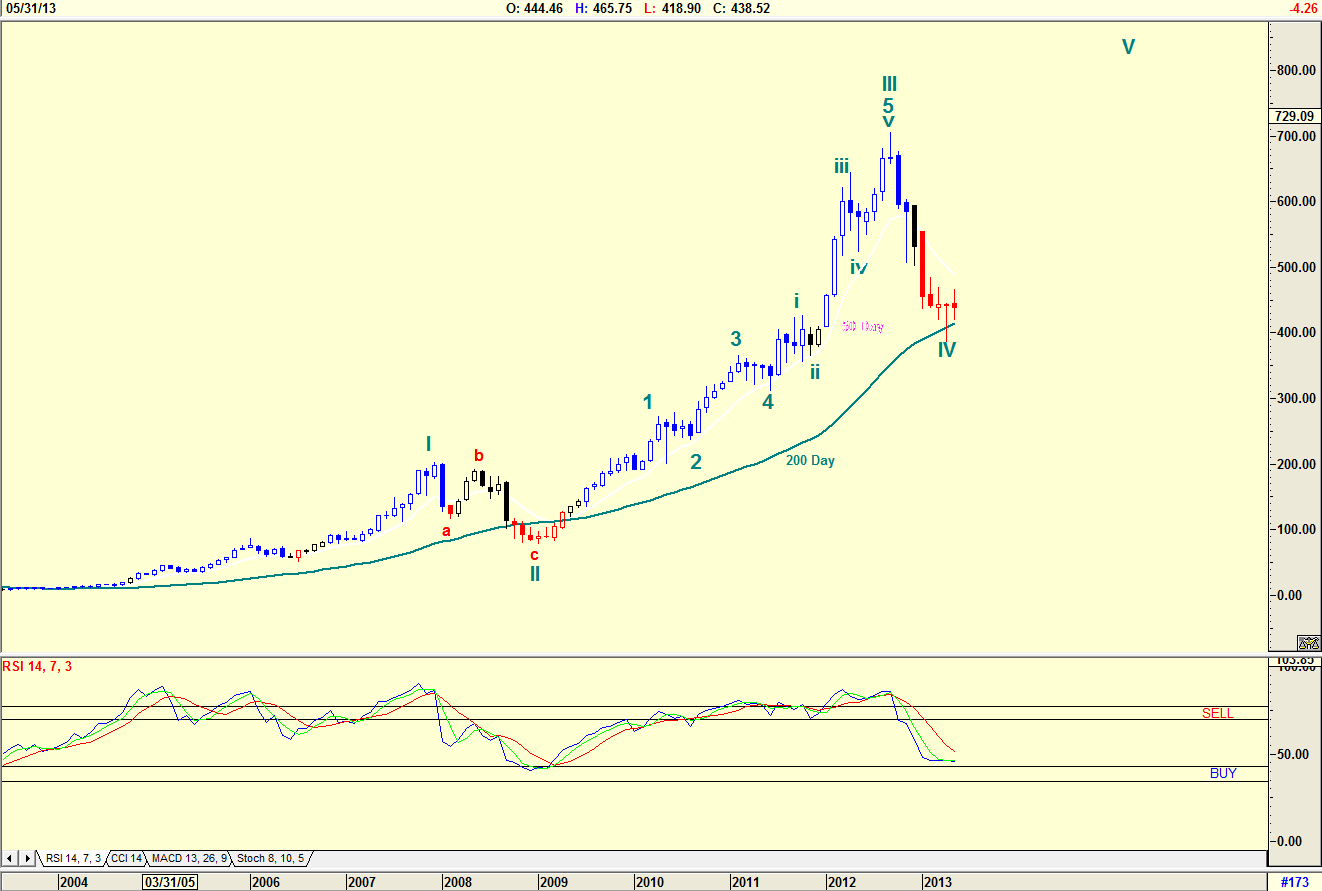
| Figure 1. Monthly Elliott wave count for Apple, Inc. |
| Graphic provided by: AdvancedGET. |
| |
| The monthly chart in Figure 1 shows my preferred Elliott Wave count. The count suggests that the share price of AAPL could be completing a major WAVE IV, bouncing off the 200-day moving average. A reversal of direction into a WAVE V is therefore in the offing. This change is confirmed by the RSI indicator, which is close to giving a buy signal. |

|
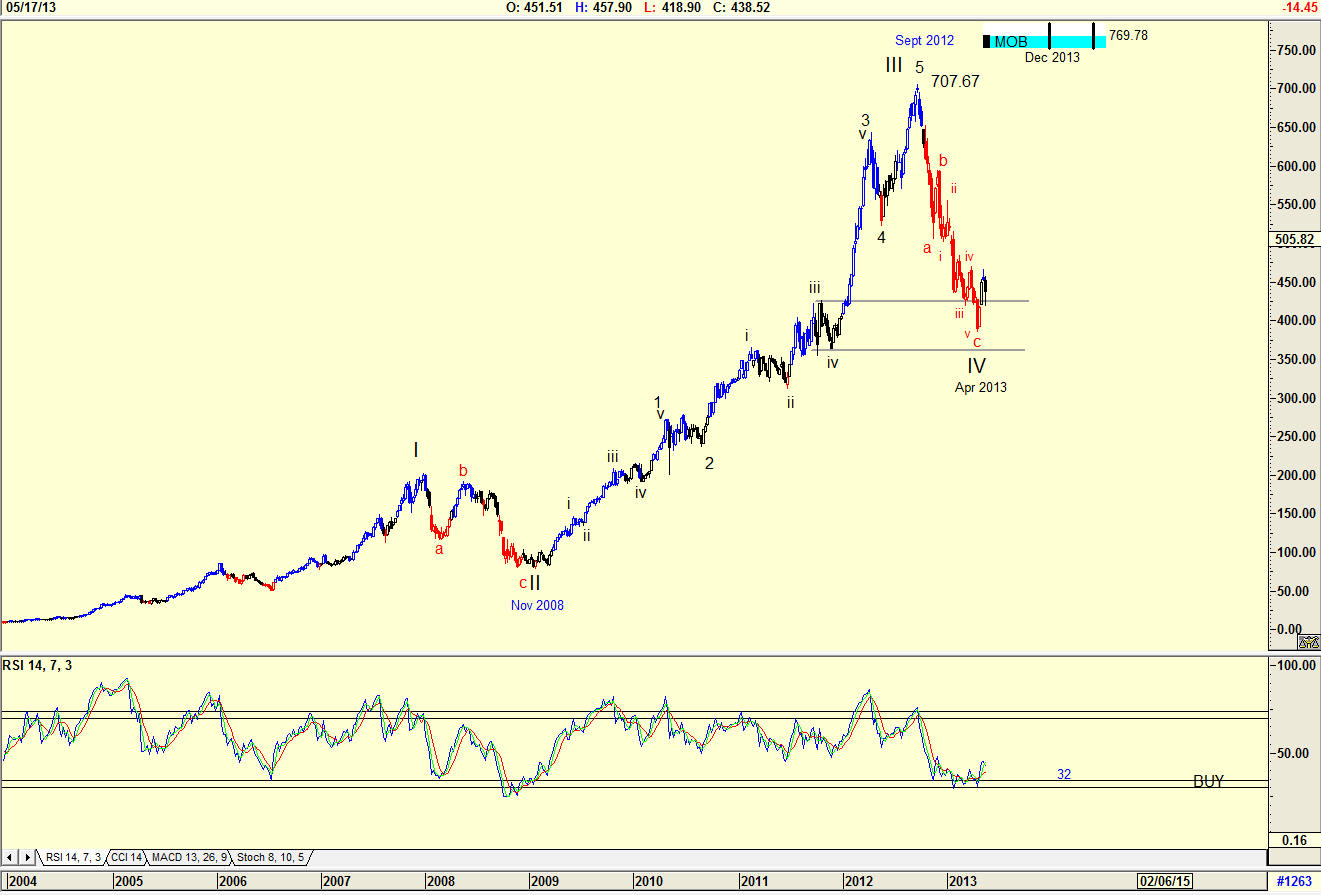
| Figure 2. Weekly Elliott wave count for Apple, Inc. with an MOB target. |
| Graphic provided by: AdvancedGET. |
| |
| Looking at the weekly chart in Figure 2, the count is identical to the monthly chart, but the RSI indicator has given a buy signal. The make or break (MOB) indicator shown on the chart is suggesting a target of $769.78 by December 2013. The MOB study is a tool supplied by the Advanced GET program that can help find the target price area for the end of an Elliott Wave 5, or for any pattern that has an impulse-correction-impulse pattern. |

|
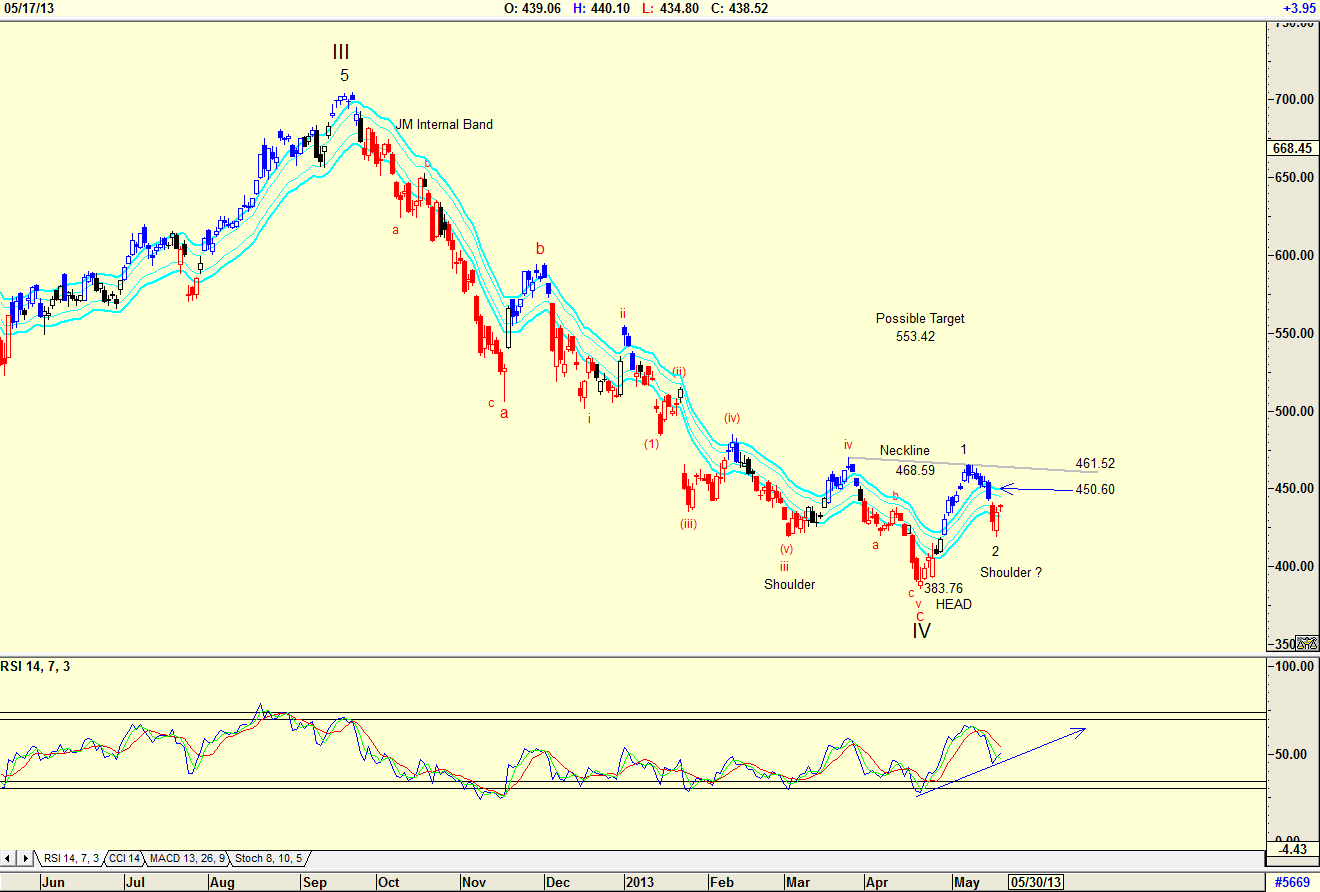
| Figure 3: Daily chart of Apple, Inc. showing short-term targets. |
| Graphic provided by: AdvancedGET. |
| |
| The daily chart in Figure 3 is suggesting that AAPL could be in a Wave 3 of a WAVE V. The RSI indicator is suggesting strength but it has been irregular over the past few months. The JM Internal Band indicator is suggesting that a buy signal will be triggered should the price break above $450.60 while the inverse head & shoulder formation that appears to be developing is suggesting a buy signal on a break above the neckline at $461.52. Should this inverse head & shoulder formation materialize, the target suggested is $553.42 (468.59-383.76 = 84.83+468.59 =553.42). Talk of an Apple TV that will supply TV over the Internet; talk of a new iPhone, although one wonders what else Tim Cook could provide that will capture Apple fans; talk even of an iPad with a 3-dimensional screen are all rumours that capture your imagination. The charts however, say that AAPL does have something in the wind. |
Has been a technical analyst since 1969, and has worked as a futures and options trader with First Financial Futures in Johannesburg, South Africa.
| Address: | 3256 West 24th Ave |
| Vancouver, BC | |
| Phone # for sales: | 6042634214 |
| E-mail address: | petroosp@gmail.com |
Click here for more information about our publications!
Comments
Date: 05/24/13Rank: 5Comment:

Request Information From Our Sponsors
- StockCharts.com, Inc.
- Candle Patterns
- Candlestick Charting Explained
- Intermarket Technical Analysis
- John Murphy on Chart Analysis
- John Murphy's Chart Pattern Recognition
- John Murphy's Market Message
- MurphyExplainsMarketAnalysis-Intermarket Analysis
- MurphyExplainsMarketAnalysis-Visual Analysis
- StockCharts.com
- Technical Analysis of the Financial Markets
- The Visual Investor
- VectorVest, Inc.
- Executive Premier Workshop
- One-Day Options Course
- OptionsPro
- Retirement Income Workshop
- Sure-Fire Trading Systems (VectorVest, Inc.)
- Trading as a Business Workshop
- VectorVest 7 EOD
- VectorVest 7 RealTime/IntraDay
- VectorVest AutoTester
- VectorVest Educational Services
- VectorVest OnLine
- VectorVest Options Analyzer
- VectorVest ProGraphics v6.0
- VectorVest ProTrader 7
- VectorVest RealTime Derby Tool
- VectorVest Simulator
- VectorVest Variator
- VectorVest Watchdog
