

HOT TOPICS LIST
- MACD
- Fibonacci
- RSI
- Gann
- ADXR
- Stochastics
- Volume
- Triangles
- Futures
- Cycles
- Volatility
- ZIGZAG
- MESA
- Retracement
- Aroon
INDICATORS LIST
LIST OF TOPICS
PRINT THIS ARTICLE
by Donald W. Pendergast, Jr.
Shares of Vale Sa. are off by nearly 29% since early January 2013, with more declines possible if key support fails to hold.
Position: N/A
Donald W. Pendergast, Jr.
Freelance financial markets writer and online publisher of the Trendzetterz.com S&P 500 Weekly Forecast service.
PRINT THIS ARTICLE
DOUBLE BOTTOMS
VALE: Key Support Test Underway
05/17/13 02:20:22 PMby Donald W. Pendergast, Jr.
Shares of Vale Sa. are off by nearly 29% since early January 2013, with more declines possible if key support fails to hold.
Position: N/A
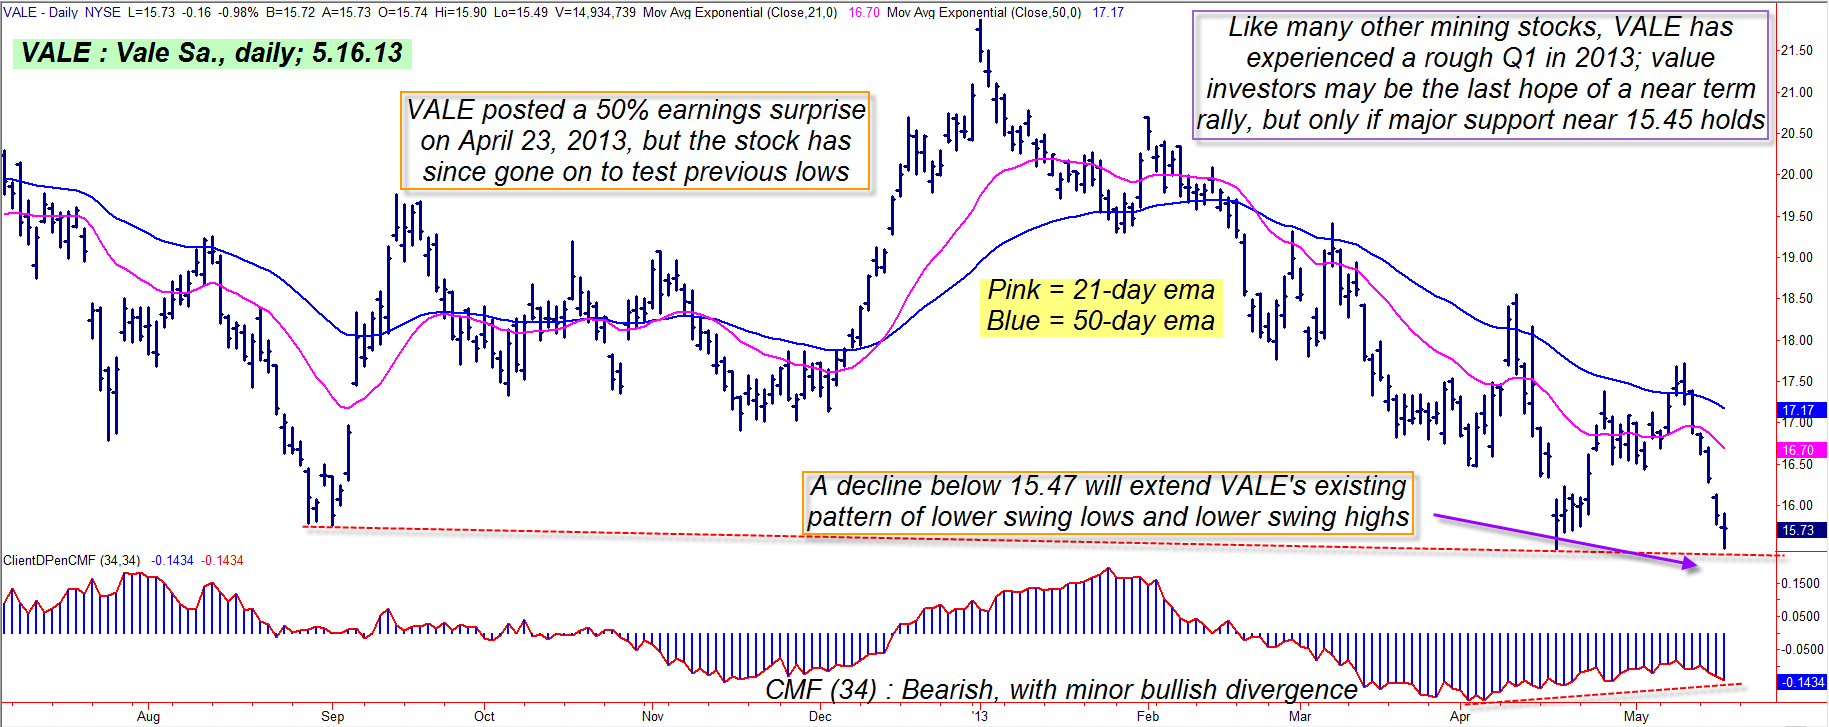
| All kinds of mining shares have taken a big hit over the past four to six months, with everything from gold/silver/platinum miners to copper/zinc/iron ore/lead miners seeing their share prices getting hit. One of the largest miners of all, Vale Sa. (VALE), based in Rio de Janeiro, Brazil, happens to mine just about all of those metals, and it has also taken quite a beating since peaking at 21.88 on January 2, 2013 (Figure 1). Currently trading near 15.70, the stock is attempting to hammer out a double bottom pattern, with the fist low of the pattern having been made at a price of 15.47 on April 17, 2013. The second low of the bottoming pattern was made during the morning session of May 16, 2013, with VALE dropping to 15.49 by 1030 ET. Looking at VALE's chart in Figure 1, you'll notice the key support line that connects three major swing lows, all of which converge in the 15.47 to 15.77 range; this is a major support in VALE and if 15.47 is taken out soon (possibly in concert with a trend reversal in the major US stock indexes), it's very possible that the stock will quickly drop toward previous swing low support level (from April 20, 2009) at 14.39. Other key supports are found at 12.72 and 11.63. |
|
| Figure 1: VALE's latest attempt at hammering out a double bottom pattern should be resolved soon; either a sharp short covering rally or a continued downtrend are possible. |
| Graphic provided by: TradeStation. |
| |
| Medium-term money flow in VALE (based on the 34-day Chaikin Money flow histogram (CMF)(34), although well below its zero line and therefore bearish, is nonetheless showing a bit of bullish divergence with the price action on the daily chart for this stock, hinting that some big money players are starting to nibble again, hoping to build a position before the stock's next rally. One clue that a rally may be the real deal for VALE is if you see Thursday's high of 15.90 exceeded; this would be a time for aggressive option sellers to consider the following trade setup: 1. On a rise above 15.90, sell the June '13 $15.00 VALE put option. This put has a bid/ask spread of only a penny and also has healthy open interest at 9,034 contracts. Daily time decay is currently $1 per day/per contract but will accelerate as June options expiration (third Friday in June) approaches. 2. If filled on a break higher by VALE, you'll have a .90 cushion between the stock's price and the second low of the double bottom pattern (still to be confirmed); by no means let either the put double in value or VALE decline below 15.47 before closing out the position. Conversely, if VALE catches a bid and moves higher, consider booking profits if the put declines in value by 50 to 60% or if VALE climbs as high as its 21-day exponential moving average (EMA) near 16.50-16.60. 3. Since this is a trend reversal type play, keep your risks small, no more than 1% of your account value. The major US stock indexes are getting ripe for a correction, but for all anyone knows they could still continue to rally — possibly for another two to four weeks — and so if you see the aforementioned reversal occur in VALE, you may find that it's a valid trade setup, one that may not be overly influenced by broad market action over the next month or so. Trade wisely until we meet here again. |
|
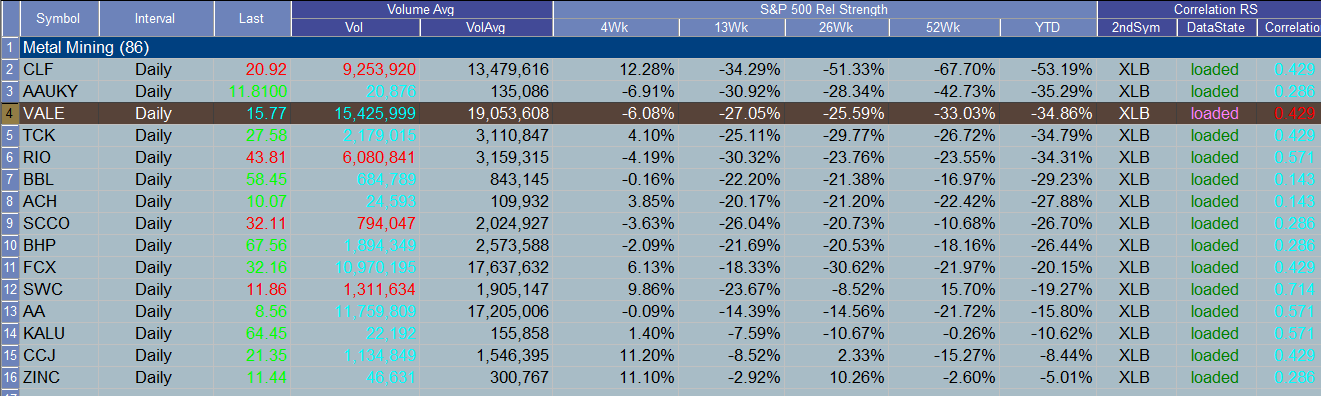
| Figure 2: VALE continues to underperform the S&P 500 index (.SPX) in a big way; note that VALE has only a .429 price history correlation with ticker XLB, the benchmark Materials sector ETF. |
| Graphic provided by: TradeStation. |
| Graphic provided by: TradeStation Radar Screen. |
| |
Freelance financial markets writer and online publisher of the Trendzetterz.com S&P 500 Weekly Forecast service.
| Title: | Market consultant and writer |
| Company: | Trendzetterz |
| Address: | 81 Hickory Hollow Drive |
| Crossville, TN 38555 | |
| Phone # for sales: | 904-303-4814 |
| Website: | trendzetterz.com |
| E-mail address: | support@trendzetterz.com |
Traders' Resource Links | |
| Trendzetterz has not added any product or service information to TRADERS' RESOURCE. | |
Click here for more information about our publications!
Comments

Request Information From Our Sponsors
- VectorVest, Inc.
- Executive Premier Workshop
- One-Day Options Course
- OptionsPro
- Retirement Income Workshop
- Sure-Fire Trading Systems (VectorVest, Inc.)
- Trading as a Business Workshop
- VectorVest 7 EOD
- VectorVest 7 RealTime/IntraDay
- VectorVest AutoTester
- VectorVest Educational Services
- VectorVest OnLine
- VectorVest Options Analyzer
- VectorVest ProGraphics v6.0
- VectorVest ProTrader 7
- VectorVest RealTime Derby Tool
- VectorVest Simulator
- VectorVest Variator
- VectorVest Watchdog
- StockCharts.com, Inc.
- Candle Patterns
- Candlestick Charting Explained
- Intermarket Technical Analysis
- John Murphy on Chart Analysis
- John Murphy's Chart Pattern Recognition
- John Murphy's Market Message
- MurphyExplainsMarketAnalysis-Intermarket Analysis
- MurphyExplainsMarketAnalysis-Visual Analysis
- StockCharts.com
- Technical Analysis of the Financial Markets
- The Visual Investor