

HOT TOPICS LIST
- MACD
- Fibonacci
- RSI
- Gann
- ADXR
- Stochastics
- Volume
- Triangles
- Futures
- Cycles
- Volatility
- ZIGZAG
- MESA
- Retracement
- Aroon
INDICATORS LIST
LIST OF TOPICS
PRINT THIS ARTICLE
by Donald W. Pendergast, Jr.
Citigroup shares continue to soar, but money flow analysis reveals that the "smart money" is already in the process of distributing their shares to lesser-informed market participants.
Position: N/A
Donald W. Pendergast, Jr.
Freelance financial markets writer and online publisher of the Trendzetterz.com S&P 500 Weekly Forecast service.
PRINT THIS ARTICLE
ACCUM./DIST. CHAIKIN
Citigroup: Money Flow Suggests Distribution Underway
05/16/13 04:57:04 PMby Donald W. Pendergast, Jr.
Citigroup shares continue to soar, but money flow analysis reveals that the "smart money" is already in the process of distributing their shares to lesser-informed market participants.
Position: N/A
| The mighty S&P 500 index (.SPX) made yet another all-time high during Wednesday's trading session, with investors continuing to plow cash into the financial sector stocks — which are one of the .SPX's primary trend drivers. Shares of Citigroup (C) are also on fire, and have been rising at a clip that puts the major stock indexes to shame. However, several technical clues are warning of an imminent stall and/or trend reversal in C shares in the days and weeks just ahead. Here's a closer look. |
|
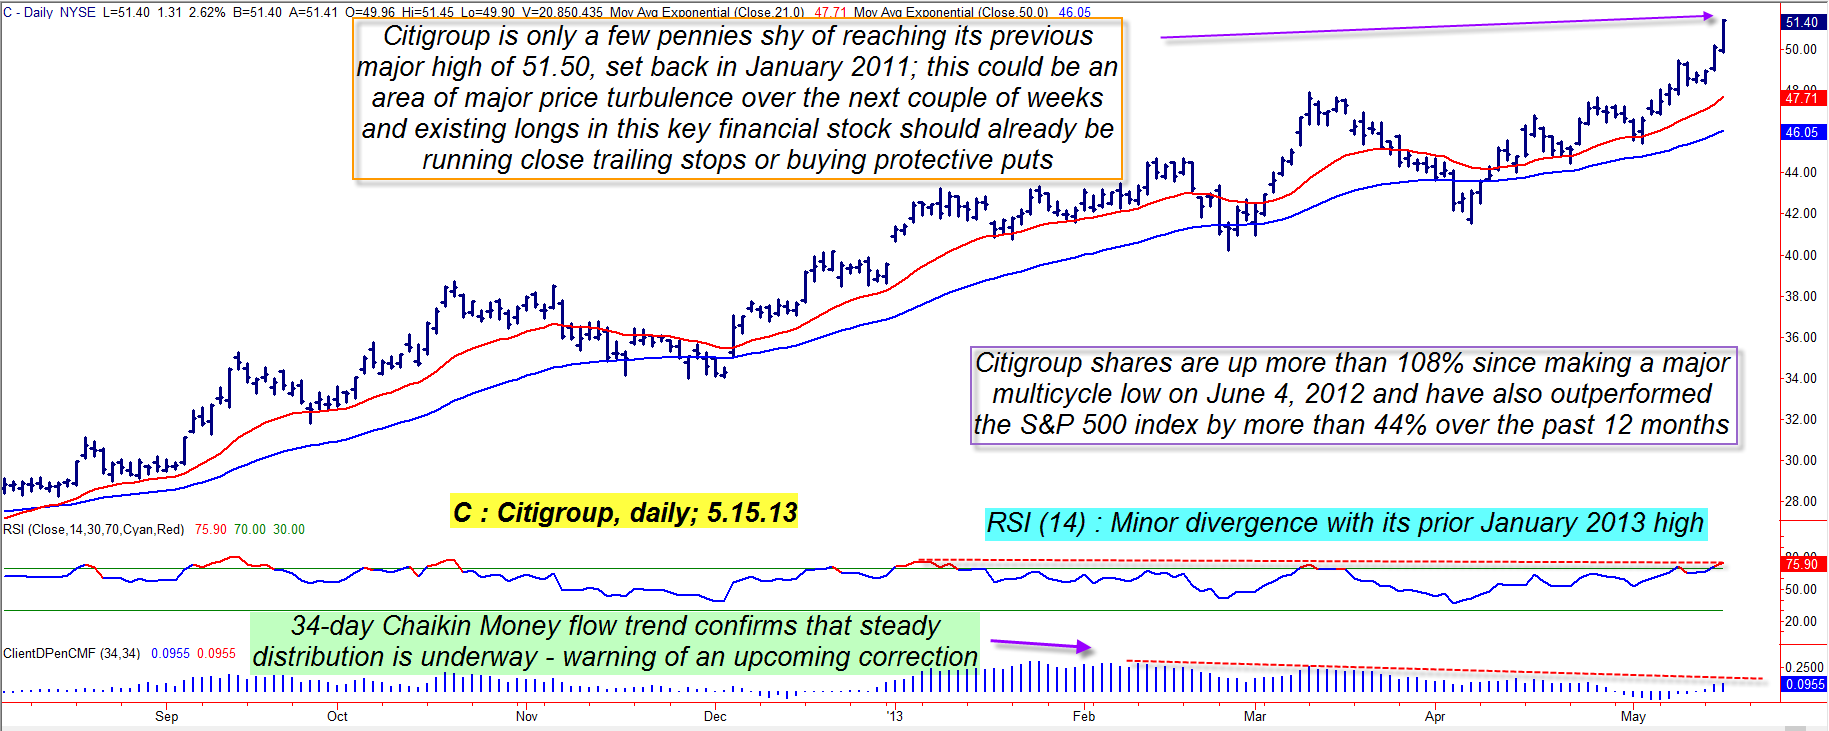
| Figure 1. Citigroup is rapidly approaching a major resistance area at 51.50, even as its upward momentum and money flow trend are slowly disintegrating. |
| Graphic provided by: TradeStation. |
| |
| Stocks in the financial sector tend to move in powerful, sustained trends several times every year, and the nearly 110% rise in Citigroup's common stock since June 2012 clearly confirms that major bank/money center bank stocks still have what it takes to outperform the .SPX on a regular basis (Figure 1). Since bottoming out at 24.61 on June 4, 2013, C has risen as high as 51.45, a gain of 109%; this is really impressive performance for a giant-cap stock that trades an average of 30 million shares per day, and institutional investors have been the primary buyers all the way up — but only to a point, and now they appear to be pulling back on the proverbial reins and are actually in process of scaling out of their C positions. The most telling evidence of this is seen in the progressively lower money flow histogram peaks (CMF)(34) that were made even as C continued to climb toward the heavens. Simply put, this means that big institutions are selling out more and more to less informed, less well-capitalized investors and have been doing so for the past three months. Another clue, one not easily spotted, is that the 14-day RSI indicator is now at a lower reading than it was when C made a significant swing high in early January 2013; together, the money flow and momentum indicators are confirming the loss of buying pressure and of upward momentum, and when this happens it's usually only a short while until a noticeable correction ensues. Existing longs in C shares need to be running a fairly close trailing stop and/or in the process of acquiring appropriate put option protection, given that a stock nearing the end of a mammoth uptrend can suddenly decide to turn on a dime, wiping out weeks (or even months) of hard-won gains in just a few trading sessions. |
|
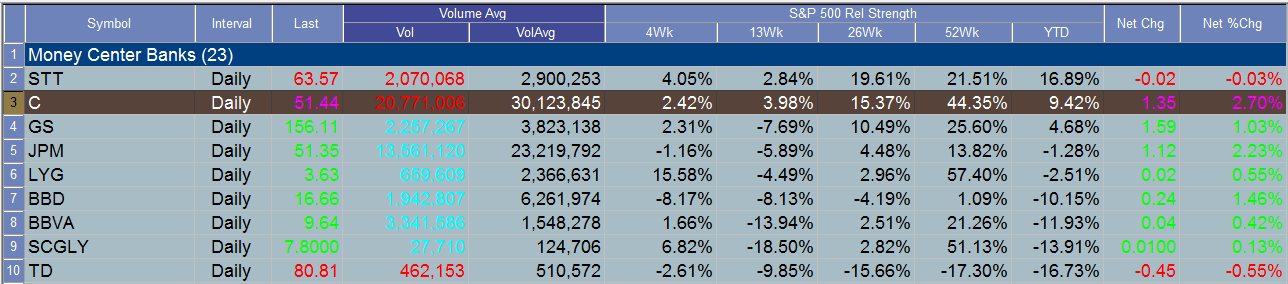
| Figure 2. Citigroup shares have performed more than 44% better than the .SPX over the past 52 weeks. |
| Graphic provided by: TradeStation. |
| Graphic provided by: TradeStation Radar Screen. |
| |
| Speculative traders might also want to consider this potential trade setup in C: 1. On an intraday decline below 49.90, buy the August '13 C $50.00 put option, risking no more than 1 to 2% of your account value. 2. Manage the long put position by using 51.45 as your initial stop and 47.69 as your price target, also making sure to close the position if the put gains by 80 to 100% or if it declines by 50%. That's really all there is to the trade; the red 21-day exponential moving average is the logical initial price target and should be reached very quickly if we are truly at/near the top of multiple degree cycle highs. Stock traders may want to hold on for deeper declines in Citigroup, but skilled option buyers know that it's usually best to take the first move to a significant support/resistance area and then close a trade at a decent profit rather than to try and swing for the fences, hoping for a fast moving major trend move. Monitor Citigroup's daily chart over the next week or so and you may very well see this trade setup activate as just described. As always, trade wisely until we meet here again. |
Freelance financial markets writer and online publisher of the Trendzetterz.com S&P 500 Weekly Forecast service.
| Title: | Market consultant and writer |
| Company: | Trendzetterz |
| Address: | 81 Hickory Hollow Drive |
| Crossville, TN 38555 | |
| Phone # for sales: | 904-303-4814 |
| Website: | trendzetterz.com |
| E-mail address: | support@trendzetterz.com |
Traders' Resource Links | |
| Trendzetterz has not added any product or service information to TRADERS' RESOURCE. | |
Click here for more information about our publications!
PRINT THIS ARTICLE

Request Information From Our Sponsors
- StockCharts.com, Inc.
- Candle Patterns
- Candlestick Charting Explained
- Intermarket Technical Analysis
- John Murphy on Chart Analysis
- John Murphy's Chart Pattern Recognition
- John Murphy's Market Message
- MurphyExplainsMarketAnalysis-Intermarket Analysis
- MurphyExplainsMarketAnalysis-Visual Analysis
- StockCharts.com
- Technical Analysis of the Financial Markets
- The Visual Investor
- VectorVest, Inc.
- Executive Premier Workshop
- One-Day Options Course
- OptionsPro
- Retirement Income Workshop
- Sure-Fire Trading Systems (VectorVest, Inc.)
- Trading as a Business Workshop
- VectorVest 7 EOD
- VectorVest 7 RealTime/IntraDay
- VectorVest AutoTester
- VectorVest Educational Services
- VectorVest OnLine
- VectorVest Options Analyzer
- VectorVest ProGraphics v6.0
- VectorVest ProTrader 7
- VectorVest RealTime Derby Tool
- VectorVest Simulator
- VectorVest Variator
- VectorVest Watchdog