

HOT TOPICS LIST
- MACD
- Fibonacci
- RSI
- Gann
- ADXR
- Stochastics
- Volume
- Triangles
- Futures
- Cycles
- Volatility
- ZIGZAG
- MESA
- Retracement
- Aroon
INDICATORS LIST
LIST OF TOPICS
PRINT THIS ARTICLE
by Donald W. Pendergast, Jr.
The great 2009-2013 bull market continues onward in the Nasdaq 100 index, but is a significant correction just ahead?
Position: N/A
Donald W. Pendergast, Jr.
Freelance financial markets writer and online publisher of the Trendzetterz.com S&P 500 Weekly Forecast service.
PRINT THIS ARTICLE
CYCLES
QQQ: Nearing A Major Multicycle High?
05/13/13 04:28:37 PMby Donald W. Pendergast, Jr.
The great 2009-2013 bull market continues onward in the Nasdaq 100 index, but is a significant correction just ahead?
Position: N/A
| Most all traders and investors agree that the March 2009 bottom in the broad US markets was of major magnitude and that it may be years — if ever — that those lows will be taken out in some future bear market. What is less in agreement is whether or not the broad US markets are due for a sharp, yet proportional correction as we head into the late spring and early summer months of 2013. Here's some compelling technical evidence that suggests that the Nasdaq 100 index may be ripe for a near-term decline. |
|
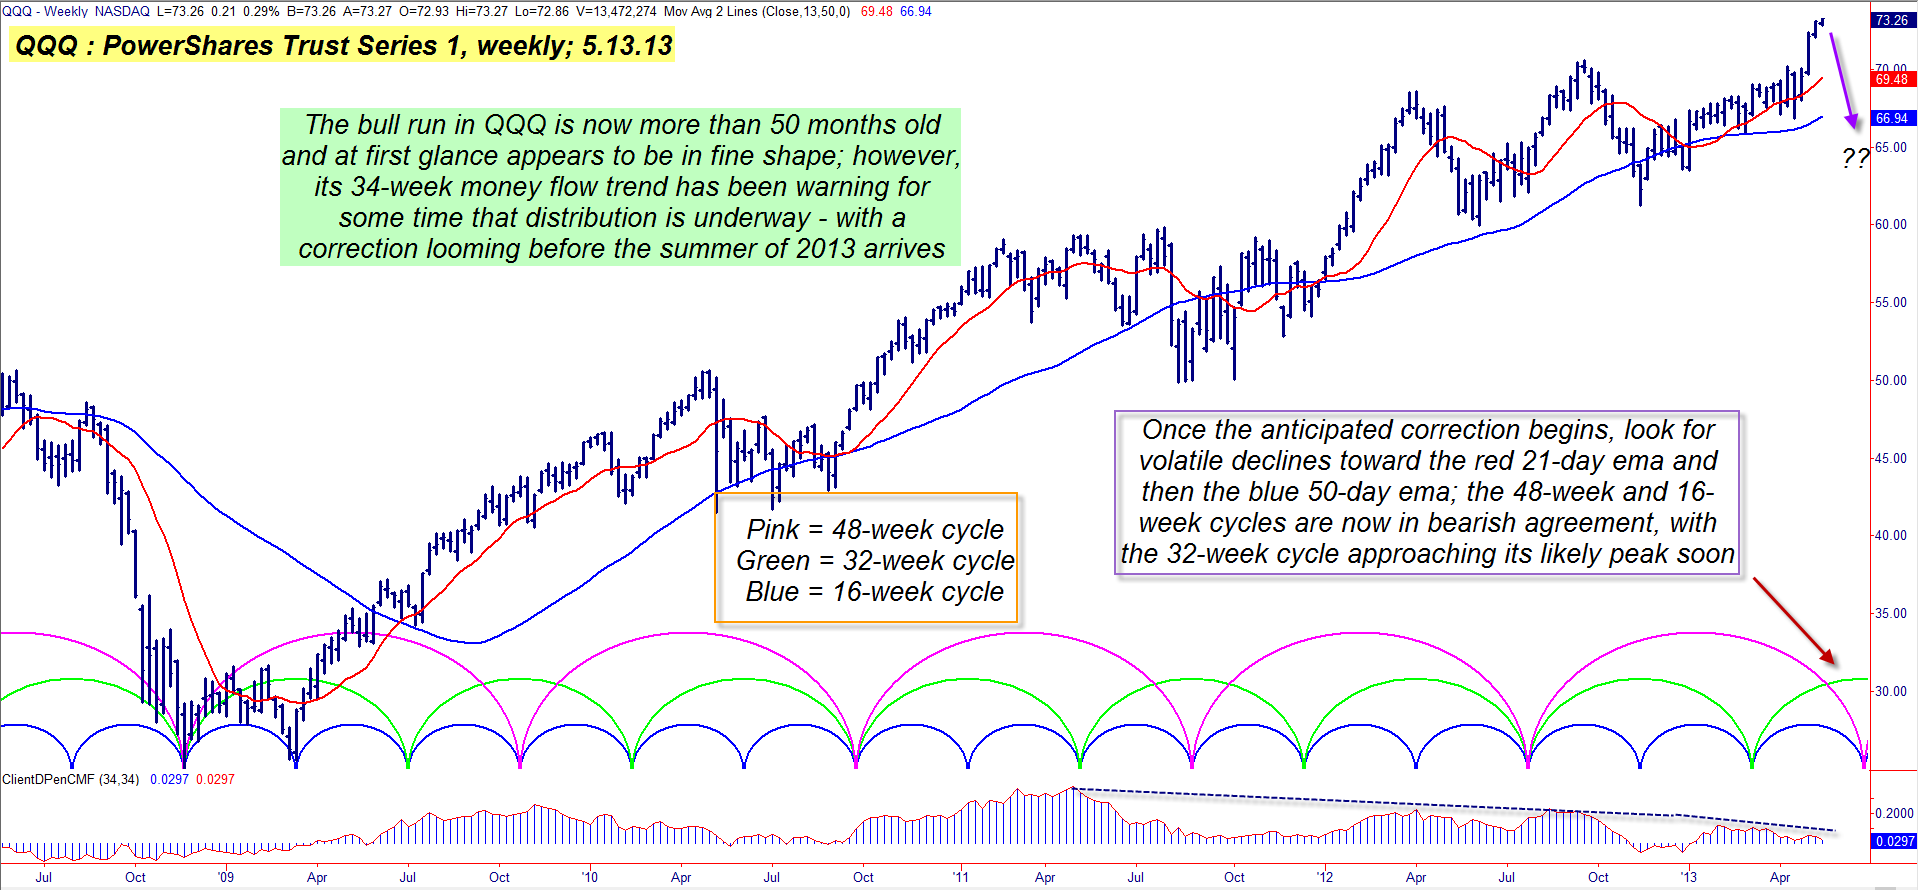
| Figure 1. What an incredible rally the QQQ has enjoyed since launching higher out of the late 2008/early 2009 lows; ongoing distribution and price cycle analysis strongly suggests that this key stock index ETF is likely due for another correction as we approach summer 2013. |
| Graphic provided by: TradeStation. |
| |
| The Invesco PowerShares Trust (Series 1), the ETF that tracks the Nasdaq 100 index, bottomed in two stages back in late 2008/early 2009; the first low was the deepest, finally finding support at a price of 25.05 during the third week of November 2008; a second major low formed during the second week of March 2009, with QQQ making a higher low at a price of 25.63 (Figure 1). From this important double bottom pattern was birthed a rally that produced gains close to 200% (actually 192.70% as of Monday May 13, 2013); note how the QQQ has managed to stay well above its blue 50-day exponential moving average (EMA) for most of the months that have passed since June 2009 and that its slope has also spent most of its time pointing in an ever-higher direction. Truly, this has been a bull market of major historic value, but what traders/investors need to discern now is how to position their portfolios just in case the QQQ decides to take a breather over the next number of months. Looking at the 34-week Chaikin Money Flow histogram (CMF)(34), we find that a pattern of long-term distribution has been underway for at least the past eight to ten months, even as the QQQ has gone on to make new swing highs (which are also multiyear highs). Essentially, the lower peaks on the histogram tells us that the more recent rally phases have been marked by less volume, with smaller traders doing more of the "heavy lifting" than usual as institutional buyers gradually reduced their long exposure in this ETF. Taking a look at a different technical dynamic, we also find that the QQQ has maintained a fairly reliable 16- and 32-week price cycle (blue and green arcs, respectively) since the November 2008 lows; there is also a 48-week cycle (pink arc) at work that is also of great interest right now; both the 16-week and 48-week cycles are suggesting an imminent downturn in QQQ, with the 32-week cycle at or very near its anticipated zenith. Given the recent six-month rally in QQQ, this is a great time for those traders with significant long Nasdaq 100 stock exposure to either invest in some put option protection or to begin to scale out of some of their better-performing stocks over the next few weeks. |
|
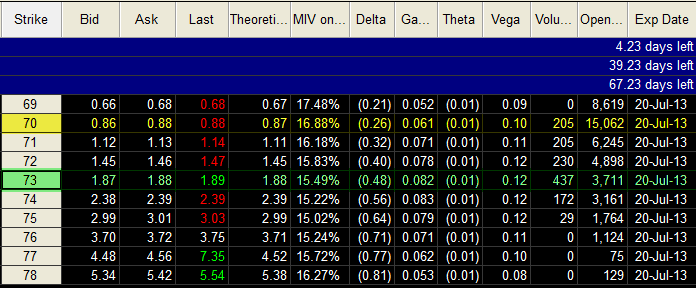
| Figure 2: The July '13 $70.00 puts may be better suited for traders seeking protection for Nasdaq 100 stock positions — but only if they believe a minor pullback is due. Speculative put buyers should focus on the July $73.00 put instead. |
| Graphic provided by: TradeStation. |
| Graphic provided by: TradeStation Options Analysis. |
| |
| The July '13 QQQ $70.00 puts have heavy open interest (15,062 contracts) compared to the $71.00 through $74.00 puts and are a good choice for those traders who are only expecting a minor pullback in QQQ to, say the red 21-week EMA. The bid-ask spread is only a penny and the put also has 9 1/2 weeks left until expiration. Of course, it's also an out-of-the-money (OTM) put, which means its delta is only (.26) and that for this put to provide meaningful protection, you'll likely need to buy them in quantity, depending on how much downside risk control you actually require. Speculative traders should instead focus on the July '13 QQQ $73.00 put, one that has a much more favorable delta of (.48); open interest for this put is at well over 3,700 contracts and the bid/ask spread is only .01. As with most "buy puts" strategies, be sure to sell them if you net a gain of 80 to 100% or if the put declines in value by .45 to .50. Traders can consider buying the $73.00 put if they see QQQ decline below 72.80 within the next seven to 10 days; the red 21-week EMA (currently near 69.50) can be your initial profit target; if you want to shoot for the bigger 50-week EMA target (near 67.00 as this is written) then you should use longer dated QQQ puts to minimize the daily time decay risk. This is a trade setup that needs to keep account risks at 2% or less, no matter how convincing this technical assessment may seem to you; as always, trade wisely until we meet here again. |
Freelance financial markets writer and online publisher of the Trendzetterz.com S&P 500 Weekly Forecast service.
| Title: | Market consultant and writer |
| Company: | Trendzetterz |
| Address: | 81 Hickory Hollow Drive |
| Crossville, TN 38555 | |
| Phone # for sales: | 904-303-4814 |
| Website: | trendzetterz.com |
| E-mail address: | support@trendzetterz.com |
Traders' Resource Links | |
| Trendzetterz has not added any product or service information to TRADERS' RESOURCE. | |
Click here for more information about our publications!
Comments

Request Information From Our Sponsors
- StockCharts.com, Inc.
- Candle Patterns
- Candlestick Charting Explained
- Intermarket Technical Analysis
- John Murphy on Chart Analysis
- John Murphy's Chart Pattern Recognition
- John Murphy's Market Message
- MurphyExplainsMarketAnalysis-Intermarket Analysis
- MurphyExplainsMarketAnalysis-Visual Analysis
- StockCharts.com
- Technical Analysis of the Financial Markets
- The Visual Investor
- VectorVest, Inc.
- Executive Premier Workshop
- One-Day Options Course
- OptionsPro
- Retirement Income Workshop
- Sure-Fire Trading Systems (VectorVest, Inc.)
- Trading as a Business Workshop
- VectorVest 7 EOD
- VectorVest 7 RealTime/IntraDay
- VectorVest AutoTester
- VectorVest Educational Services
- VectorVest OnLine
- VectorVest Options Analyzer
- VectorVest ProGraphics v6.0
- VectorVest ProTrader 7
- VectorVest RealTime Derby Tool
- VectorVest Simulator
- VectorVest Variator
- VectorVest Watchdog