HOT TOPICS LIST
- MACD
- Fibonacci
- RSI
- Gann
- ADXR
- Stochastics
- Volume
- Triangles
- Futures
- Cycles
- Volatility
- ZIGZAG
- MESA
- Retracement
- Aroon
INDICATORS LIST
LIST OF TOPICS
PRINT THIS ARTICLE
by Donald W. Pendergast, Jr.
Up by more than 71% since June 2012, shares of Oceaneering International may be due to correct back to test support soon.
Position: N/A
Donald W. Pendergast, Jr.
Freelance financial markets writer and online publisher of the Trendzetterz.com S&P 500 Weekly Forecast service.
PRINT THIS ARTICLE
MOMENTUM
Oceaneering International: Good Fundamentals But Due To Correct
05/10/13 11:10:34 AMby Donald W. Pendergast, Jr.
Up by more than 71% since June 2012, shares of Oceaneering International may be due to correct back to test support soon.
Position: N/A
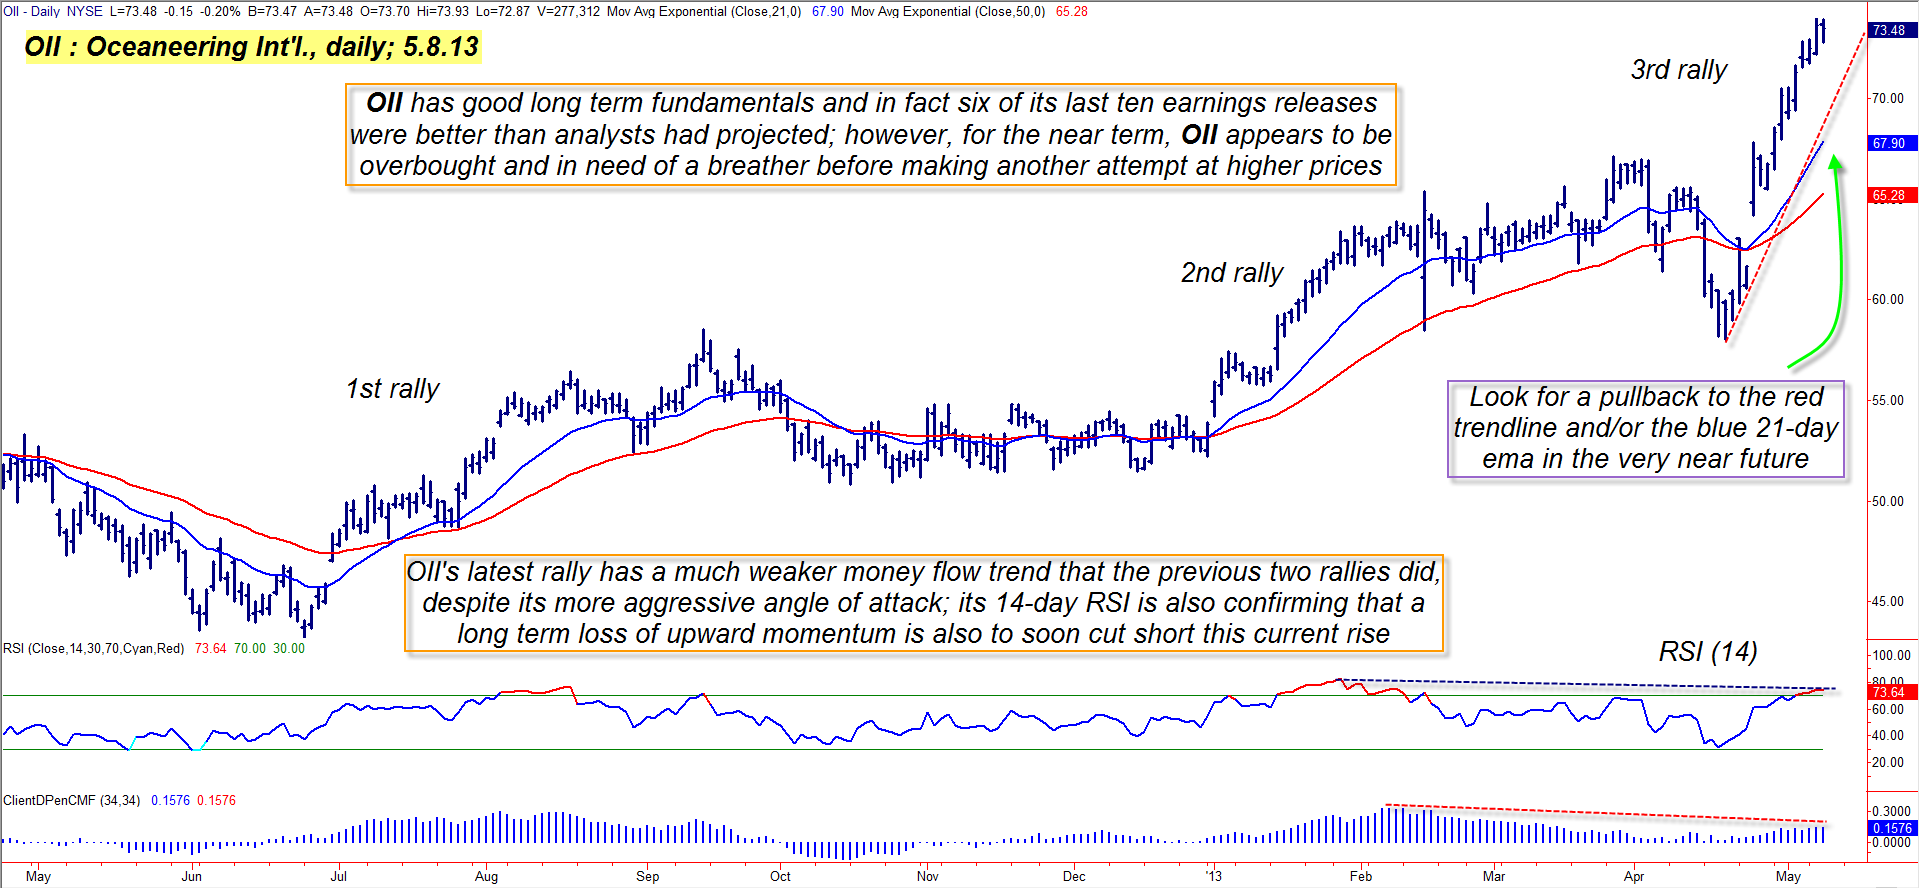
| Being a stock from the volatile oil services industry group, shares of Oceaneering Int'l (OII) have enjoyed three major waves up since bottoming out at 43.22 on June 25, 2012; now at a value of 74.00, the stock is looking more vulnerable than ever to a near-term pullback to support. Here's a closer look. |

|
| Figure 1: While OII's latest rally is impressive, it simply does not have the same amount of bullish money flow as its previous two rallies had. |
| Graphic provided by: TradeStation. |
| |
| Using two exponential moving averages (a 21-day and 50-day) it's easy to identify stocks that are in or may be preparing to enter a strong intermediate trend phase; since making a major multicycle low in late June 2012, OII's fast 21-day EMA has not spent much time at all below its slower 50-day EMA — and when it has been below it has always remained in close proximity to the longer degree EMA (Figure 1). The current spread between the two EMAs is now at its widest point since the rally out of the June 2012 lows began and when you see how high the angle of attack of the current rally is, you begin to wonder just how much higher OII can go before exhaustion sets in. Given that the 14-day RSI indicator is already confirming a pronounced bearish divergence and that the 34-day Chaikin Money Flow histogram (CMF)(34) is also suggesting a relative lack of buying enthusiasm (that is, lower trading volume than either of the previous two rallies on the chart), it would make sense for existing longs in OII to begin actively protecting any open profits that they may have acquired. This can easily be done by running a close trailing stop (such as the red trend line on the chart), scaling out of the position to lock in at least partial profits or even buying put options to protect against a sudden correction. Longer term, position traders/investors should realize that OII is also trading at an all-time high and is vulnerable to an even larger degree decline at some point. |

|
| Figure 2: OII currently has very good comparative strength vs. the .SPX and also against its peers in the oil services industry group. |
| Graphic provided by: TradeStation. |
| Graphic provided by: TradeStation Radar Screen. |
| |
| OII is in good shape as far as its earnings and revenues are concerned; in fact, the stock has beaten its earnings estimates in six of its past ten reporting periods, meaning that this stock is of great interest to institutional investors over the long haul. Given that reality, traders should be cautious if shorting OII and most conservative traders and investors should wait for a proportional pullback to a major support level before deciding to go long this stock. A very simple way to do this is to wait for potential pullbacks to the following key support levels: 1. The 21-day EMA - near 67.94 2. The 50-day EMA - 65.30 3. The red up trend line - near 70.00 As each support level is approached, look to see if the RSI(14) is going into oversold territory (below 30.00) and then consider a new long entry on a reversal of the RSI back above 30. You can even drop down to a 45-, 60- or even 90-minute chart to help improve your timing for taking advantage of a good low-risk buying opportunity in OII. Keep your trade risks at no more than 2% of account value for daily-based setups and at 1% or less for intraday swing setups (45-90 minute time frames) and you'll help minimize any damage resulting from trades that don't work out exactly as planned. Trade wisely until we meet here again. |
Freelance financial markets writer and online publisher of the Trendzetterz.com S&P 500 Weekly Forecast service.
| Title: | Market consultant and writer |
| Company: | Trendzetterz |
| Address: | 81 Hickory Hollow Drive |
| Crossville, TN 38555 | |
| Phone # for sales: | 904-303-4814 |
| Website: | trendzetterz.com |
| E-mail address: | support@trendzetterz.com |
Traders' Resource Links | |
| Trendzetterz has not added any product or service information to TRADERS' RESOURCE. | |
Click here for more information about our publications!
PRINT THIS ARTICLE

Request Information From Our Sponsors
- VectorVest, Inc.
- Executive Premier Workshop
- One-Day Options Course
- OptionsPro
- Retirement Income Workshop
- Sure-Fire Trading Systems (VectorVest, Inc.)
- Trading as a Business Workshop
- VectorVest 7 EOD
- VectorVest 7 RealTime/IntraDay
- VectorVest AutoTester
- VectorVest Educational Services
- VectorVest OnLine
- VectorVest Options Analyzer
- VectorVest ProGraphics v6.0
- VectorVest ProTrader 7
- VectorVest RealTime Derby Tool
- VectorVest Simulator
- VectorVest Variator
- VectorVest Watchdog
- StockCharts.com, Inc.
- Candle Patterns
- Candlestick Charting Explained
- Intermarket Technical Analysis
- John Murphy on Chart Analysis
- John Murphy's Chart Pattern Recognition
- John Murphy's Market Message
- MurphyExplainsMarketAnalysis-Intermarket Analysis
- MurphyExplainsMarketAnalysis-Visual Analysis
- StockCharts.com
- Technical Analysis of the Financial Markets
- The Visual Investor
