

HOT TOPICS LIST
- MACD
- Fibonacci
- RSI
- Gann
- ADXR
- Stochastics
- Volume
- Triangles
- Futures
- Cycles
- Volatility
- ZIGZAG
- MESA
- Retracement
- Aroon
INDICATORS LIST
LIST OF TOPICS
PRINT THIS ARTICLE
by Donald W. Pendergast, Jr.
Outperforming all other S&P 100 index component stocks over the last four weeks, shares of Microsoft Corp. appear due for a breather.
Position: N/A
Donald W. Pendergast, Jr.
Freelance financial markets writer and online publisher of the Trendzetterz.com S&P 500 Weekly Forecast service.
PRINT THIS ARTICLE
RSI
Microsoft: Is Its Bull Run Done?
05/08/13 01:35:45 PMby Donald W. Pendergast, Jr.
Outperforming all other S&P 100 index component stocks over the last four weeks, shares of Microsoft Corp. appear due for a breather.
Position: N/A
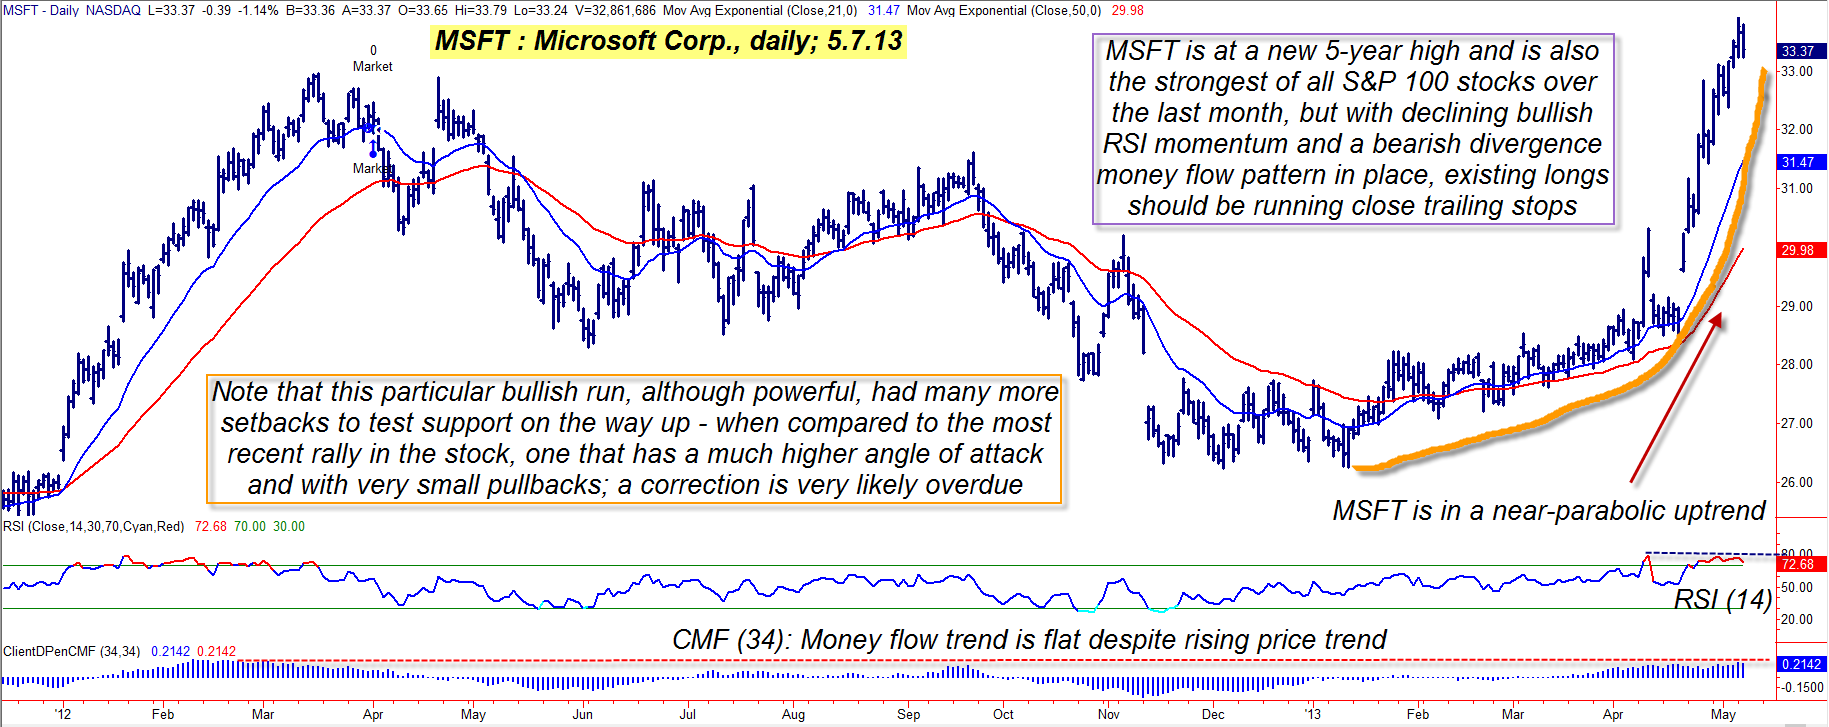
| Shares of Microsoft Corp. (MSFT) have risen more than 25% since making a major multicycle low on January 13, 2013, and are now in what may be the latter stages of a near-parabolic ascent that may soon lead to a noticeable correction in price. Here's a closer look (Figure 1). |
|
| Figure 1: Typically, a powerful near-parabolic rise such as this one on Microsoft's daily chart is a warning that a proportional corrective move is just ahead; the negative RSI and CMF divergences are also hinting of a near term correction. |
| Graphic provided by: TradeStation. |
| |
| Microsoft Corp. common stock (MFST) seems to trend in one of two modes: 1. Choppy, volatile trend moves within a fairly narrow channel (as seen during February/March 2013) that are difficult to stay with. 2. Smooth, sustained trend moves with wide-range daily bars; these are the kind that trend followers and even swing traders are always on the lookout for. Unfortunately, no one really knows how an emerging trend will eventually play out, but at least we know that MSFT is in the midst of a powerful bullish trend, one that recently began to go near-parabolic. If you compare the most recent rally in the stock with the one seen on the left side of its daily chart, its easy to spot the differences between the two; the previous rally was marked by frequent pullbacks to near-term support levels and as the move matured it took on a hunched over posture — a sure sign of ever slowing upward momentum. Compare that move with the current rally and you'll find that the pullbacks have been tiny — almost inconsequential — during the past month of its incredible run higher. Every powerful rise like this, however, eventually exhausts itself before correcting some of its excesses, and as we look at MSFT's daily chart it's easy to see that its 14-day RSI indicator is manifesting a bearish divergence with price even as its 34-day Chaikin Money flow histogram (CMF)(34) (bottom of chart) is at a lower peak than seen during the last big rally in the stock. Basically, the daily chart image is one of a stock that is running out of sufficient "fuel" to warrant much more of a rise before a pullback to major support takes place. Traders with existing long positions would be wise to run close trailing stops and/or to buy some appropriate put option protection — just in case the eventual correction occurs on an overnight bearish gap — while the stock is still in a technical uptrend. Put values will inflate on a sudden drop, so make sure you buy your protection early while puts are reasonably priced. |
|
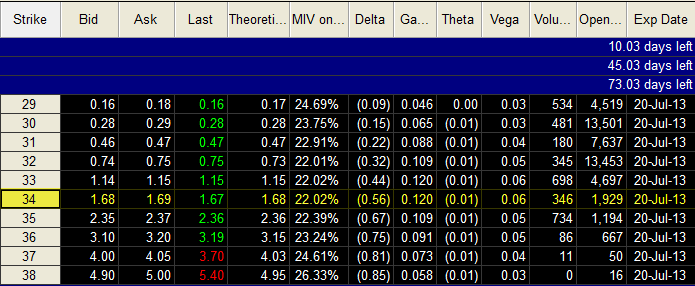
| Figure 2: The July '13 MSFT $34 puts offer a very small bid/ask spread, a small daily theta factor and substantial open interest of more than 1,900 contracts. |
| Graphic provided by: TradeStation. |
| Graphic provided by: TradeStation Options Analysis. |
| |
| With MSFT's next support levels being near 32.39 and 31.45, aggressive traders might want to look at buying puts as a speculative opportunity: 1. If MSFT declines below 33.24, consider the purchase of the July '13 MSFT $34 put option(s); they have a tiny bid/ask spread of only a penny, daily time decay (theta) is $1/day per contract and the open interest figure comes in at a healthy 1,929 contracts. 2. If filled on the trade, look to use the 32.39 support level as your profit target; aggressive traders might also want to use 31.50 as a more distant target for the remainder of your position. 3. Risk no more than 1 to 2% of your account value for the trade, no matter how bearish you are in the short-term on MSFT; also remember to sell your puts if they either double in price or if they decline by 50%. You can also choose to manage this trade with a three-bar trailing stop of the daily highs, which should also give you a decent margin of protection against large losses. MSFT — and the broad markets — may be due for some near-term profit taking and this put option trade might be one of the better low risk ways to make some cash should the correction arrive within the next week or so. Trade wisely until we meet here again. |
Freelance financial markets writer and online publisher of the Trendzetterz.com S&P 500 Weekly Forecast service.
| Title: | Market consultant and writer |
| Company: | Trendzetterz |
| Address: | 81 Hickory Hollow Drive |
| Crossville, TN 38555 | |
| Phone # for sales: | 904-303-4814 |
| Website: | trendzetterz.com |
| E-mail address: | support@trendzetterz.com |
Traders' Resource Links | |
| Trendzetterz has not added any product or service information to TRADERS' RESOURCE. | |
Click here for more information about our publications!
Comments

Request Information From Our Sponsors
- StockCharts.com, Inc.
- Candle Patterns
- Candlestick Charting Explained
- Intermarket Technical Analysis
- John Murphy on Chart Analysis
- John Murphy's Chart Pattern Recognition
- John Murphy's Market Message
- MurphyExplainsMarketAnalysis-Intermarket Analysis
- MurphyExplainsMarketAnalysis-Visual Analysis
- StockCharts.com
- Technical Analysis of the Financial Markets
- The Visual Investor
- VectorVest, Inc.
- Executive Premier Workshop
- One-Day Options Course
- OptionsPro
- Retirement Income Workshop
- Sure-Fire Trading Systems (VectorVest, Inc.)
- Trading as a Business Workshop
- VectorVest 7 EOD
- VectorVest 7 RealTime/IntraDay
- VectorVest AutoTester
- VectorVest Educational Services
- VectorVest OnLine
- VectorVest Options Analyzer
- VectorVest ProGraphics v6.0
- VectorVest ProTrader 7
- VectorVest RealTime Derby Tool
- VectorVest Simulator
- VectorVest Variator
- VectorVest Watchdog