HOT TOPICS LIST
- MACD
- Fibonacci
- RSI
- Gann
- ADXR
- Stochastics
- Volume
- Triangles
- Futures
- Cycles
- Volatility
- ZIGZAG
- MESA
- Retracement
- Aroon
INDICATORS LIST
LIST OF TOPICS
PRINT THIS ARTICLE
by Gary Grosschadl
The outcome of this potentially bearish pattern is crucial to the Dow in the short-term and the closing action the next two days should be very telling.
Position: N/A
Gary Grosschadl
Independent Canadian equities trader and technical analyst based in Peterborough
Ontario, Canada.
PRINT THIS ARTICLE
CHART ANALYSIS
The Dow's Bearish Rising Wedge
08/20/02 01:19:06 PMby Gary Grosschadl
The outcome of this potentially bearish pattern is crucial to the Dow in the short-term and the closing action the next two days should be very telling.
Position: N/A
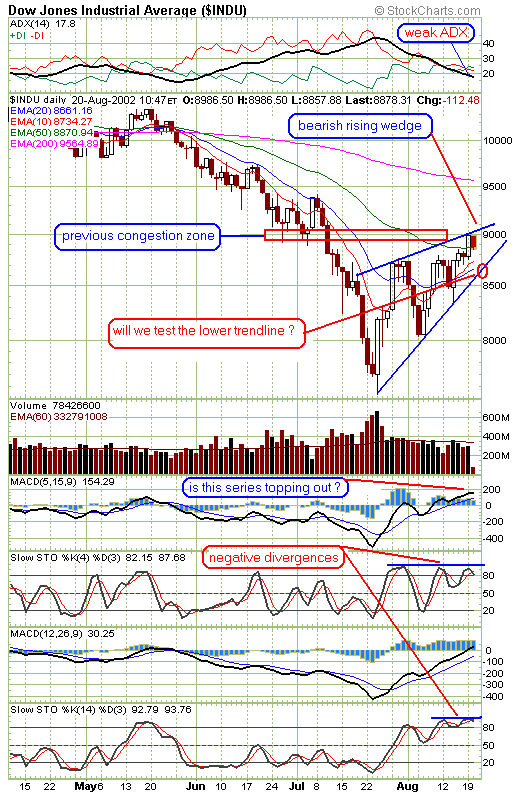
| On Friday the Dow made a bold move past its 50-day EMA resistance to give the bulls some hope in the near term. However what was previous support becomes potential new resistance. The chart shows the danger of Dow stalling here at the 9000 level, a previous congestion zone. This may lead to a test of the lower trendline of this wedge pattern. Failure here could lead to some serious downside back to the sub-7500, to perhaps challenge previous lows. |
| The current ADX indicator shows a weak number -- below 20 -- and still downsloping. This shows a potentially poor likelihood of a bounce at or near this lower trendline. A high ADX reading often results in a bullish bounce from nearby support, such as the 20-day EMA, resulting in a bullish resumption of the previous trend. A low ADX speaks of poor trend strength making the Dow's recent rise suspect. The stochastics indicators as displayed also hint at a likely downturn here with stochastic negative divergence to recent index levels. The MACD series are still bullish but show signs of being toppy and should be watched for further confirmation either way. |

|
| Graphic provided by: stockcharts.com. |
| |
| The volume considerations for this pattern are also correct as volume diminishes throughout the rising wedge pattern. If the lower trendline does not hold, it should bring a high volume decline. The measurement of the possible decline is taken from the vertical height at the start, or large end of the wedge. This could result in a 1000 point drop (or more) taken to the maximum bearish extreme. |
| A surprise move to the upside, past the top trendline would negate the bearish tone of this rising wedge pattern. At least, traders might expect a test of the lower trendline around the 8600 zone and the outcome there should be closely watched for further downside or even renewed upside. The markets remain reversal oriented in these volatile times and short-term traders should be alert to upside and downside possibilities. |
Independent Canadian equities trader and technical analyst based in Peterborough
Ontario, Canada.
| Website: | www.whatsonsale.ca/financial.html |
| E-mail address: | gwg7@sympatico.ca |
Click here for more information about our publications!
Comments
Date: 08/21/02Rank: 5Comment:
Date: 08/22/02Rank: 3Comment: Can you tell me how a bullish ascending triangle can morph into a bearish wedge? I ll try to answer my own question. If you don t include the last four sessions. On 8/14 last the Dow and S p 500 whose charts are virtually indentical broke out from their W bottom ascending triangle formations. The neckline of the W bottom is the same as the top base of the ascending triangle. On the S P the breakout was at 912 the Dow in the 8400 area. I went long in Rydex based on this. Now I m sitting long in the trade and four sessions later the ascending triangle bottom has magically morphed into a wedge. I would place precedence on the ascending triangle over the wedge. The number one thing I d be looking for would be not a bearish wedge but penetration of 950 on the S P and 9000 on the Dow. Well folks that happened today and I am well on my way to a successful trade.
Date: 08/27/02Rank: 5Comment:
Date: 08/27/02Rank: 4Comment: i wouldn t agree more!
Date: 08/28/02Rank: 5Comment:
Date: 08/29/02Rank: 5Comment: Not all of the graphics can be seen. Also, how often will this chart be updated?
Date: 08/30/02Rank: 4Comment:
Date: 09/04/02Rank: 5Comment:

Request Information From Our Sponsors
- VectorVest, Inc.
- Executive Premier Workshop
- One-Day Options Course
- OptionsPro
- Retirement Income Workshop
- Sure-Fire Trading Systems (VectorVest, Inc.)
- Trading as a Business Workshop
- VectorVest 7 EOD
- VectorVest 7 RealTime/IntraDay
- VectorVest AutoTester
- VectorVest Educational Services
- VectorVest OnLine
- VectorVest Options Analyzer
- VectorVest ProGraphics v6.0
- VectorVest ProTrader 7
- VectorVest RealTime Derby Tool
- VectorVest Simulator
- VectorVest Variator
- VectorVest Watchdog
- StockCharts.com, Inc.
- Candle Patterns
- Candlestick Charting Explained
- Intermarket Technical Analysis
- John Murphy on Chart Analysis
- John Murphy's Chart Pattern Recognition
- John Murphy's Market Message
- MurphyExplainsMarketAnalysis-Intermarket Analysis
- MurphyExplainsMarketAnalysis-Visual Analysis
- StockCharts.com
- Technical Analysis of the Financial Markets
- The Visual Investor
