HOT TOPICS LIST
- MACD
- Fibonacci
- RSI
- Gann
- ADXR
- Stochastics
- Volume
- Triangles
- Futures
- Cycles
- Volatility
- ZIGZAG
- MESA
- Retracement
- Aroon
INDICATORS LIST
LIST OF TOPICS
PRINT THIS ARTICLE
by Donald W. Pendergast, Jr.
Having experienced a rise of 80% in the past 11 months, shares of TWX are beginning to become more vulnerable to a correction.
Position: N/A
Donald W. Pendergast, Jr.
Freelance financial markets writer and online publisher of the Trendzetterz.com S&P 500 Weekly Forecast service.
PRINT THIS ARTICLE
RSI
Time Warner: Vulnerable To A Correction Soon?
05/07/13 04:22:51 PMby Donald W. Pendergast, Jr.
Having experienced a rise of 80% in the past 11 months, shares of TWX are beginning to become more vulnerable to a correction.
Position: N/A
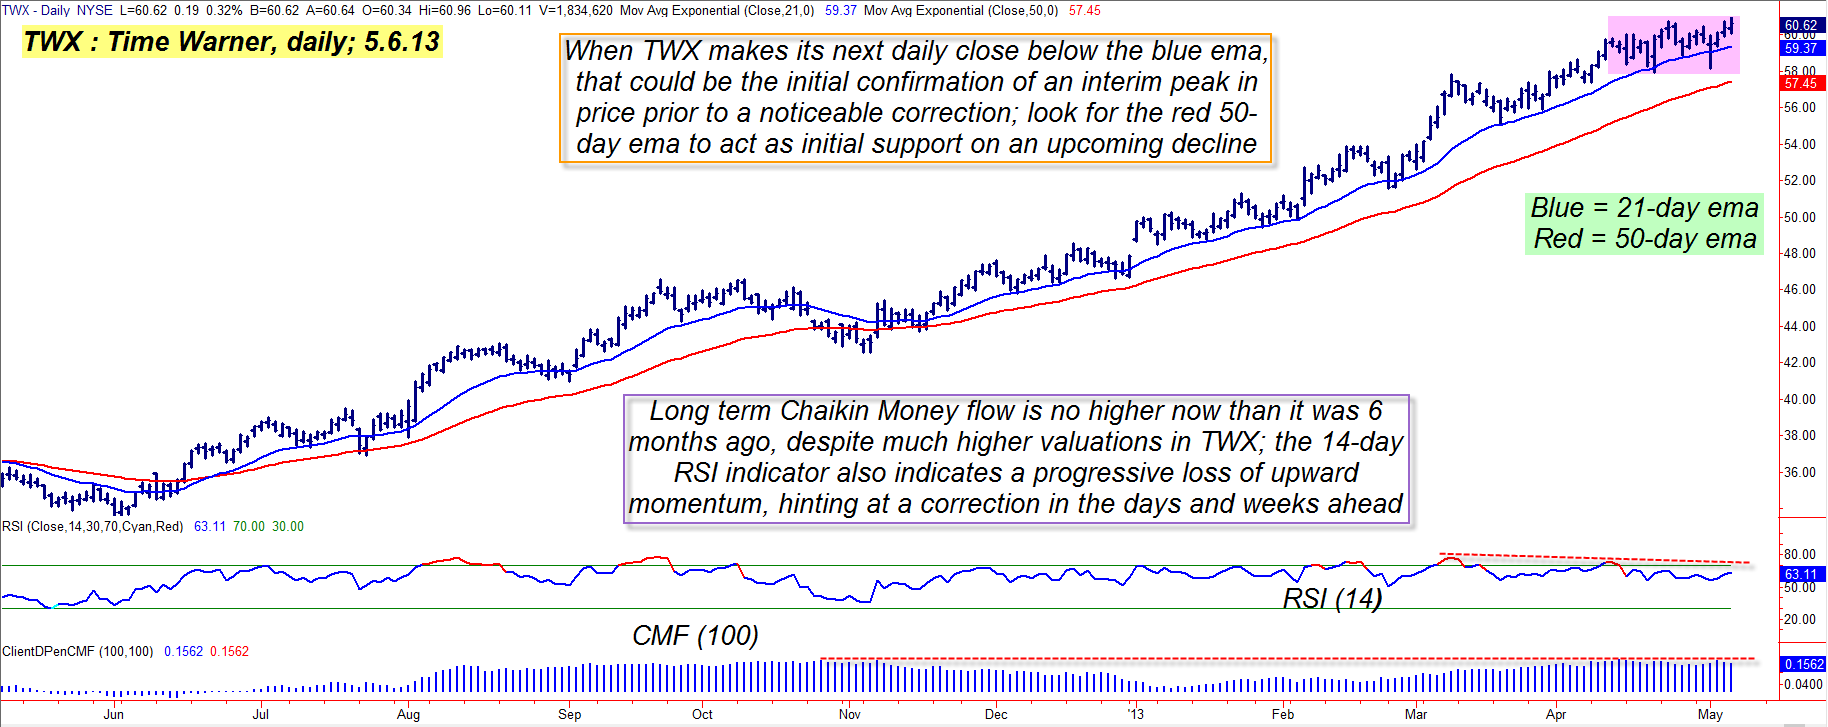
| Some stocks trend in a violent, semi-chaotic "two steps forward, one step back" pattern, with investors and traders continually having to second-guess their positions in the stock or ETF in question; many gold mining and energy sector stocks tend to manifest this kind of behavior; the stock we'll look at today is the polar opposite of such trading tendencies — Time Warner shares have been trudging ever higher with a remarkably low volatility factor, rising from 33.62 to 60.85 during its most recent bullish run. Several technical dynamics, however, are now warning that TWX may be more vulnerable to a near-term correction down to a major support level. Here's a closer look (Figure 1). |

|
| Figure 1: With shares of Time Warner (TWX) now losing upward momentum at a time of static money flow trend, aggressive traders may find that a decline below the pink range area may lead to a fast drop down to support in the $57.00 to $58.00 area. |
| Graphic provided by: TradeStation. |
| |
| One of the most impressive technical aspects of TWX's daily chart is that its blue 21-day exponential moving average (EMA) has remained above its slower 50-day EMA since June 21, 2012 — a timespan of about 46 weeks. Note how stable the spread has been between these two important EMAs, further confirming the low volatility and trend worthiness of the stock's incredible trend move. TWX is also at an 11-year high which is also impressive, although it is still trading well below its all-time highs of 261.57 set back in December 1999. But the following warning signs of a near-term top are now coming into clear view: 1. The stock's long-term money flow histogram — based on the 100-day Chaikin Money flow indicator — now confirms that the most recent portion of TWX's rally has been accomplished on smaller volumes and comparatively smaller daily price ranges. This is an early confirmation that distribution of shares from "strong hands" to "weak hands" is already underway. 2. TWX's upward momentum is also slowly losing steam, as evidenced by the lower highs on its last two RSI(14) indicator peaks. Generally speaking, most investors should avoid establishing new long positions (stock or covered calls) at this time, waiting instead for TWX to put in its next pullback to support; in this case, the red 50-day EMA is the first logical support point for the stock, so look for the $57.00 to $58.00 area to be a place where bulls looking for a fresh opportunity to go long TWX begin to get aggressive with their bids. |

|
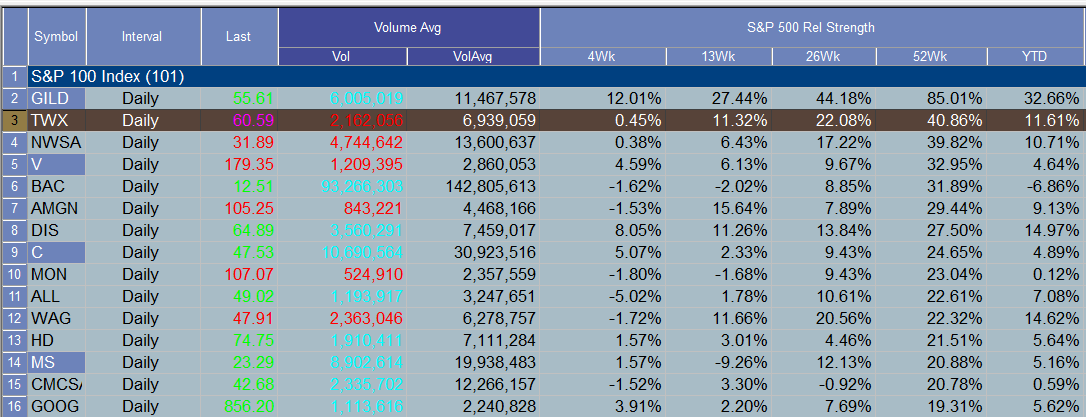
| Figure 2: TWX is the second-best performer in the S&P 100 index (.OEX) over the past 52 weeks. |
| Graphic provided by: TradeStation. |
| Graphic provided by: TradeStation Radar Screen. |
| |
| Aggressive traders might want to investigate the possibility of buying put options in TWX once the stock drops below the pink shaded range on the chart; use the 50-day EMA as your initial price target and cut your losses short if the put declines in value by 50% before hitting the target. The July '13 TWX $57.50 puts have a close bid/ask spread, a daily time decay factor (theta) of only $1/day per contract and an open interest figure of 1,529 contracts, and if TWX breaks down soon, going long such puts will give a trader more than two months of time until options expiration for the stock to make a move down toward the 50-day EMA support level. The risk on this trade is modest, but by no means risk more than 2% of your account equity on this setup, no matter how convinced you may be that the stock is due for a significant correction. As always, trade wisely until we meet here again. |
Freelance financial markets writer and online publisher of the Trendzetterz.com S&P 500 Weekly Forecast service.
| Title: | Market consultant and writer |
| Company: | Trendzetterz |
| Address: | 81 Hickory Hollow Drive |
| Crossville, TN 38555 | |
| Phone # for sales: | 904-303-4814 |
| Website: | trendzetterz.com |
| E-mail address: | support@trendzetterz.com |
Traders' Resource Links | |
| Trendzetterz has not added any product or service information to TRADERS' RESOURCE. | |
Click here for more information about our publications!
PRINT THIS ARTICLE

Request Information From Our Sponsors
- VectorVest, Inc.
- Executive Premier Workshop
- One-Day Options Course
- OptionsPro
- Retirement Income Workshop
- Sure-Fire Trading Systems (VectorVest, Inc.)
- Trading as a Business Workshop
- VectorVest 7 EOD
- VectorVest 7 RealTime/IntraDay
- VectorVest AutoTester
- VectorVest Educational Services
- VectorVest OnLine
- VectorVest Options Analyzer
- VectorVest ProGraphics v6.0
- VectorVest ProTrader 7
- VectorVest RealTime Derby Tool
- VectorVest Simulator
- VectorVest Variator
- VectorVest Watchdog
- StockCharts.com, Inc.
- Candle Patterns
- Candlestick Charting Explained
- Intermarket Technical Analysis
- John Murphy on Chart Analysis
- John Murphy's Chart Pattern Recognition
- John Murphy's Market Message
- MurphyExplainsMarketAnalysis-Intermarket Analysis
- MurphyExplainsMarketAnalysis-Visual Analysis
- StockCharts.com
- Technical Analysis of the Financial Markets
- The Visual Investor
