

HOT TOPICS LIST
- MACD
- Fibonacci
- RSI
- Gann
- ADXR
- Stochastics
- Volume
- Triangles
- Futures
- Cycles
- Volatility
- ZIGZAG
- MESA
- Retracement
- Aroon
INDICATORS LIST
LIST OF TOPICS
PRINT THIS ARTICLE
by Donald W. Pendergast, Jr.
Shares of Boeing Company continue to gain altitude, setting yet another new multiyear high.
Position: N/A
Donald W. Pendergast, Jr.
Freelance financial markets writer and online publisher of the Trendzetterz.com S&P 500 Weekly Forecast service.
PRINT THIS ARTICLE
NEW HIGHS-NEW LOWS
Boeing Soars To New Multiyear High
05/06/13 03:02:40 PMby Donald W. Pendergast, Jr.
Shares of Boeing Company continue to gain altitude, setting yet another new multiyear high.
Position: N/A
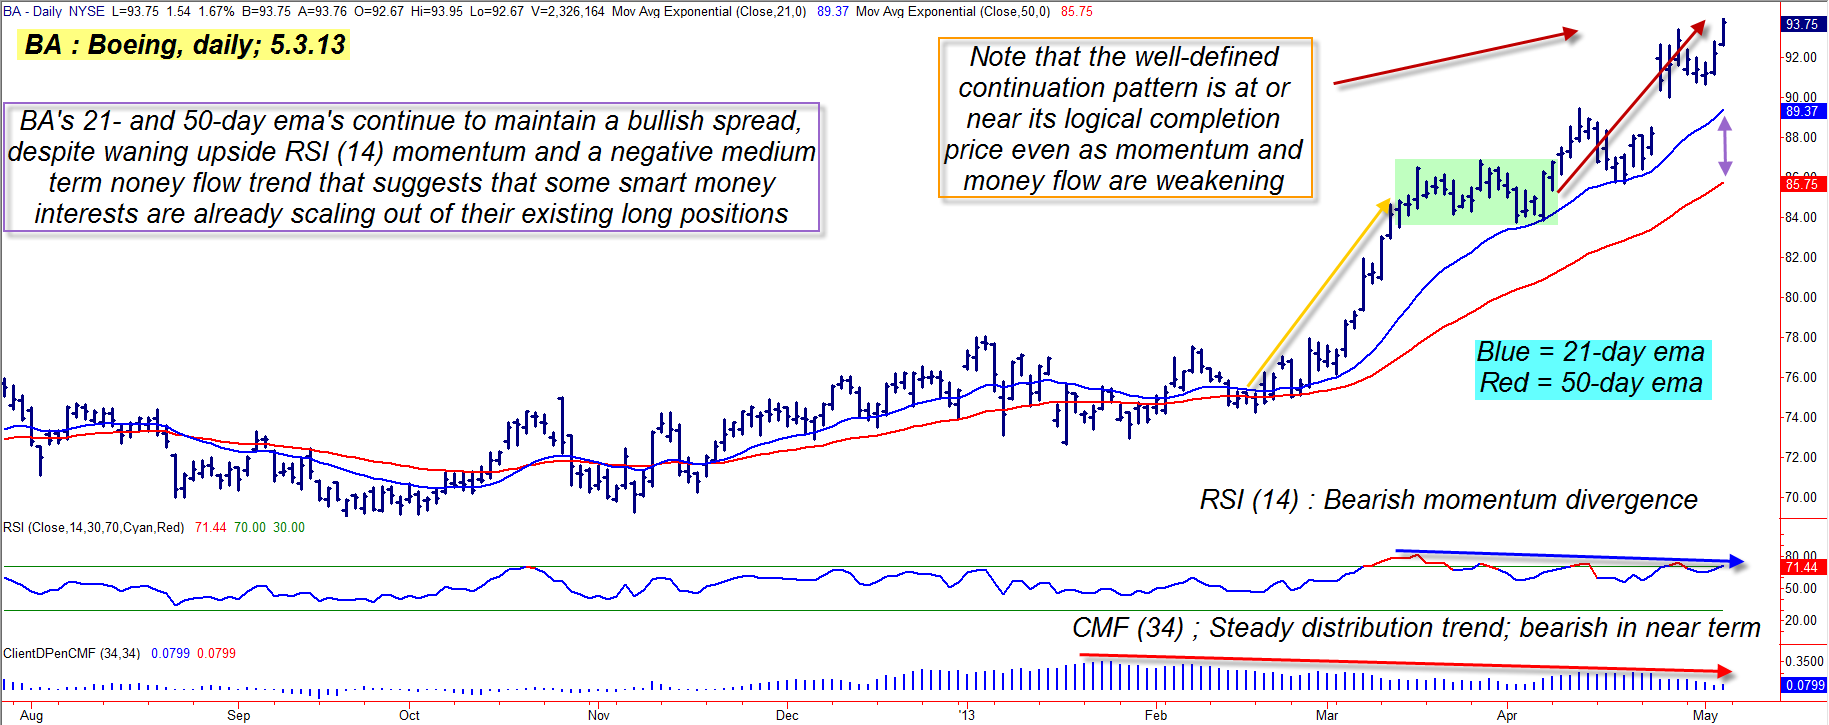
| Since embarking on its most recent bullish thrust on February 19, 2013, shares of Boeing Company (BA) are up by 26%, with the potential for even more upside, long-term. Over the next month or two, however, the company's common stock looks vulnerable to profit taking by the "smart money" — leading to a proportional correction to key support areas. Here's a closer look (Figure 1). |
|
| Figure 1: With shares of Boeing Company (BA) now nearing the pattern completion target of its latest bullish continuation move, traders need to be prepared for profit takers to knock the price of the stock down toward the $89.00 to $90.00 level. |
| Graphic provided by: TradeStation. |
| |
| BA, like many other large caps in the .OEX (S&P 100 index) tends to lead a double life — it spends as much time chopping around in small swing moves as it does making longer lasting trending moves, the kind that covered call and trend followers tend to enjoy. It's been in the trending mode since early November 2012, with the most recent 10-week period providing the bulk of the upside gains for the stock. At first glance, it looks to be in a steady uptrend without any warning signs, that is, if you mostly just look at its pattern of higher swing highs and higher swing lows (the textbook definition of an uptrend), or its equally textbook-quality bullish continuation pattern, a pattern that may soon be approaching its price peak target. But, if you also look at two of BA's key momentum/divergence indicators, you'll note these two bearish warning flags: 1. The 14-day RSI indicator keeps making lower peaks even as BA moves higher on its daily chart. 2. The 34-day Chaikin Money Flow histogram is confirming that the "smart money" interests in this key big cap manufacturing stock has been selling out of their positions since early February 2013 and that the pace of this distribution is now accelerating somewhat. Taken together, these three differing technical dynamics (price pattern target, money flow and momentum) are strongly suggesting that the most likely near-term trend for BA is toward lower prices over the next month, possibly with a correction down to test its key 50-day exponential moving average (EMA) support, currently near $85.74. |
|
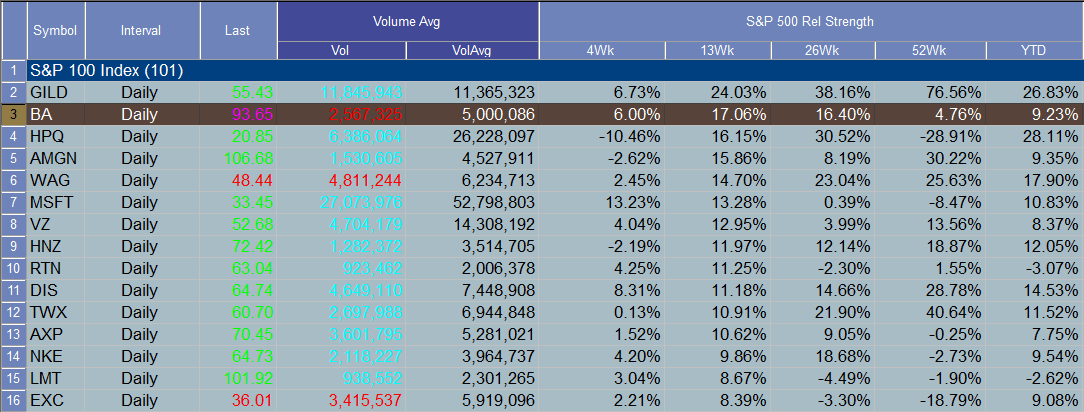
| Figure 2: BA has the second-strongest 13-week relative strength ranking among all 100 .OEX stocks vs. the .SPX. |
| Graphic provided by: TradeStation. |
| Graphic provided by: TradeStation Radar Screen. |
| |
| With the Dow 30 (.DJIA) and S&P 500 (.SPX) indexes just making new all-time highs, bullish fever is widespread, meaning that "surprise" market moves will likely be to the downside over the next month or so; given what we've just learned about BA, here's a way to get prepared for a possible "unexpected" decline in BA down below the 90.00 level: 1. On a drop below $92.67, consider buying a July '13 BA $95.00 put option; this put has a small bid/ask spread of only a nickel, it is in-the-money, and its current open interest figure is 69 contracts. 2. If filled on the trade, use the blue 21-day EMA as your initial profit target for half your position and use the red 50-day EMA as your final profit target. If the put or puts double in price at any time, sell them and walk away with a nice profit; conversely, if they decline in value by 50% or if BA rises above $94.50 sell them at a loss and wait for a better trade setup to come along. Only aggressive traders should go for the 50-day EMA target price of $86.00 or so; they may also want to use the August '13 BA $95.00 put instead, thus giving the trade more time to prove out. |
| For all anyone knows, once BA does finally correct, it may once again surge to even higher highs in the second half of 2013. For now, however, traders need to be prepared for what could come as a swift and powerful correction back below the $90.00 level in this stock. Limit your risk for this trade to only 1% of your account value and remember to trade wisely until we meet here again. |
Freelance financial markets writer and online publisher of the Trendzetterz.com S&P 500 Weekly Forecast service.
| Title: | Market consultant and writer |
| Company: | Trendzetterz |
| Address: | 81 Hickory Hollow Drive |
| Crossville, TN 38555 | |
| Phone # for sales: | 904-303-4814 |
| Website: | trendzetterz.com |
| E-mail address: | support@trendzetterz.com |
Traders' Resource Links | |
| Trendzetterz has not added any product or service information to TRADERS' RESOURCE. | |
Click here for more information about our publications!
PRINT THIS ARTICLE

Request Information From Our Sponsors
- StockCharts.com, Inc.
- Candle Patterns
- Candlestick Charting Explained
- Intermarket Technical Analysis
- John Murphy on Chart Analysis
- John Murphy's Chart Pattern Recognition
- John Murphy's Market Message
- MurphyExplainsMarketAnalysis-Intermarket Analysis
- MurphyExplainsMarketAnalysis-Visual Analysis
- StockCharts.com
- Technical Analysis of the Financial Markets
- The Visual Investor
- VectorVest, Inc.
- Executive Premier Workshop
- One-Day Options Course
- OptionsPro
- Retirement Income Workshop
- Sure-Fire Trading Systems (VectorVest, Inc.)
- Trading as a Business Workshop
- VectorVest 7 EOD
- VectorVest 7 RealTime/IntraDay
- VectorVest AutoTester
- VectorVest Educational Services
- VectorVest OnLine
- VectorVest Options Analyzer
- VectorVest ProGraphics v6.0
- VectorVest ProTrader 7
- VectorVest RealTime Derby Tool
- VectorVest Simulator
- VectorVest Variator
- VectorVest Watchdog