HOT TOPICS LIST
- MACD
- Fibonacci
- RSI
- Gann
- ADXR
- Stochastics
- Volume
- Triangles
- Futures
- Cycles
- Volatility
- ZIGZAG
- MESA
- Retracement
- Aroon
INDICATORS LIST
LIST OF TOPICS
PRINT THIS ARTICLE
by Koos van der Merwe
Facebook came out with their quarterly results at the close of market on May 1, 2013. Would you still buy Facebook shares?
Position: Buy
Koos van der Merwe
Has been a technical analyst since 1969, and has worked as a futures and options trader with First Financial Futures in Johannesburg, South Africa.
PRINT THIS ARTICLE
HEAD & SHOULDERS
Facebook Again
05/02/13 03:48:09 PMby Koos van der Merwe
Facebook came out with their quarterly results at the close of market on May 1, 2013. Would you still buy Facebook shares?
Position: Buy
| "We've made a lot of progress in the first few months of the year. We have seen strong growth and engagement across our community and launched several exciting products." So said Mark Zuckerberg, Facebook (FB) founder and CEO when he reported financial results for the first quarter, which ended March 31, 2013. Revenue from advertising was $1.25 billion, representing 85% of total revenue and a 43% increase from the same quarter last year. OK, so this is all fundamentals, but what did the market think of this report? The market seemed to like it. The share price which was $27.44 at close of day on May 1st, rose to $28.68 at the time of writing on May 2nd, a 4.56% increase in price. What is the future of Facebook? Is it a buy even at this price? To answer this, you must look at the charts. |

|
| Figure 1. Daily chart with JM Internal Band. |
| Graphic provided by: AdvancedGET. |
| |
| The daily chart of FB in Figure 1 shows the JM Internal Band indicator and shows that the share gave a buy signal on April 26, 2013 — five days before the quarterly results were due. This suggests that the market believed that FB would come out with good results. The JM Internal Band indicator is a 15-period simple moving average offset by 2% positive and 2% negative. A buy signal is given when the price breaks above the upper band, and a sell signal is given when the price breaks below the lower band. Stop losses must be in place. Do note that the chart shows a buy signal given on March 7, 2013. On March 8, 2013, the day a buy order would be placed, the price moved down strongly. You would probably not have placed an order to buy. Note also that the RSI indicator is trending upwards. |

|
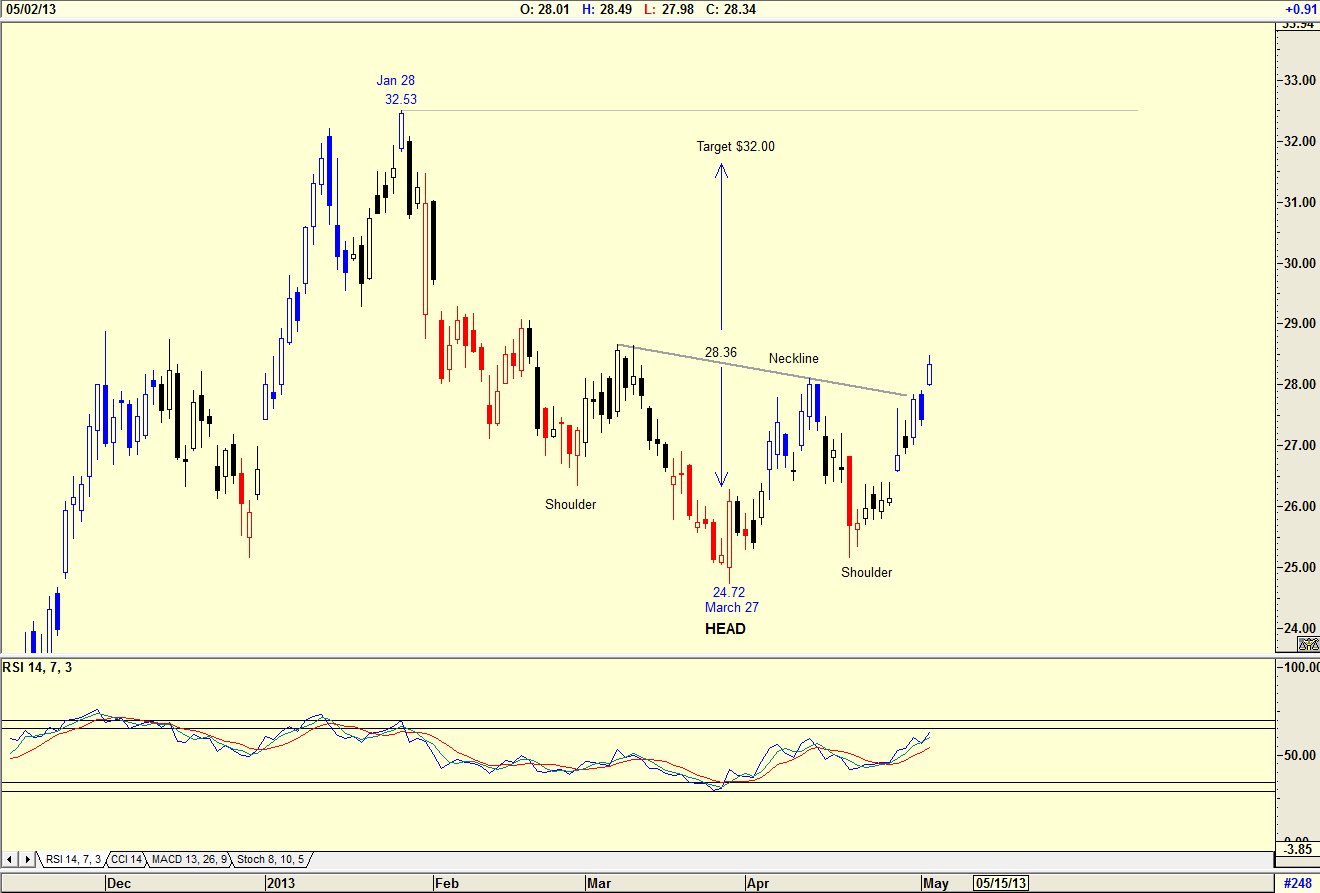
| Figure 2. Daily chart showing Inverse head & shoulders. |
| Graphic provided by: AdvancedGET. |
| |
| The chart in Figure 2 is a daily chart suggesting that an inverse head & shoulders formation has formed, suggesting a target of $32.00; (28.36 - 24.72 = 3.64 + 28.36 = 32.00). You would expect the price to test $32.53, the high of January 28, 2013. |

|
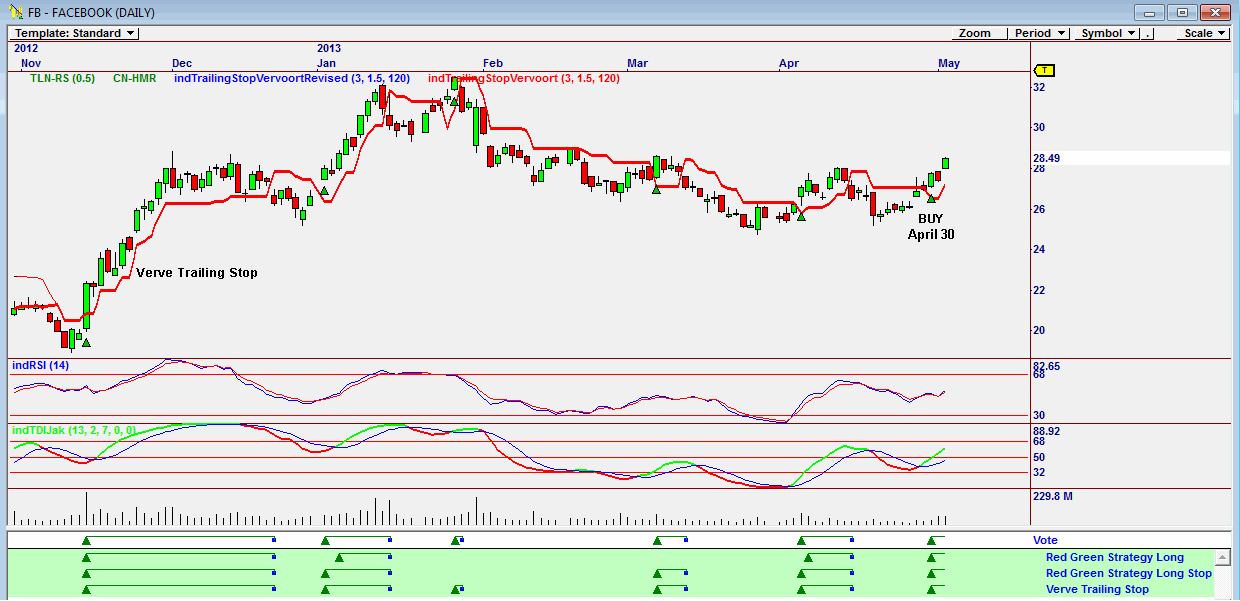
| Figure 3. Daily chart showing VOTE line buy and stop loss signals. |
| Graphic provided by: Omnitrader. |
| |
| The chart in Figure 3 is an Omnitrader chart. You can see that the VOTE line, a summation of the three strategies, Red Green Long, Red Green Long Stop and Verve Trailing stop gave a buy signal on April 30, 2013. Note that the two indicators — 14-period RSI and the TDIJak indicators are both positive. To conclude, based on the charts which measure market sentiment, I would have been a buyer of FB shares ahead of their report. |
Has been a technical analyst since 1969, and has worked as a futures and options trader with First Financial Futures in Johannesburg, South Africa.
| Address: | 3256 West 24th Ave |
| Vancouver, BC | |
| Phone # for sales: | 6042634214 |
| E-mail address: | petroosp@gmail.com |
Click here for more information about our publications!
Comments
Date: 05/03/13Rank: 5Comment:

|

Request Information From Our Sponsors
- StockCharts.com, Inc.
- Candle Patterns
- Candlestick Charting Explained
- Intermarket Technical Analysis
- John Murphy on Chart Analysis
- John Murphy's Chart Pattern Recognition
- John Murphy's Market Message
- MurphyExplainsMarketAnalysis-Intermarket Analysis
- MurphyExplainsMarketAnalysis-Visual Analysis
- StockCharts.com
- Technical Analysis of the Financial Markets
- The Visual Investor
- VectorVest, Inc.
- Executive Premier Workshop
- One-Day Options Course
- OptionsPro
- Retirement Income Workshop
- Sure-Fire Trading Systems (VectorVest, Inc.)
- Trading as a Business Workshop
- VectorVest 7 EOD
- VectorVest 7 RealTime/IntraDay
- VectorVest AutoTester
- VectorVest Educational Services
- VectorVest OnLine
- VectorVest Options Analyzer
- VectorVest ProGraphics v6.0
- VectorVest ProTrader 7
- VectorVest RealTime Derby Tool
- VectorVest Simulator
- VectorVest Variator
- VectorVest Watchdog
