

HOT TOPICS LIST
- MACD
- Fibonacci
- RSI
- Gann
- ADXR
- Stochastics
- Volume
- Triangles
- Futures
- Cycles
- Volatility
- ZIGZAG
- MESA
- Retracement
- Aroon
INDICATORS LIST
LIST OF TOPICS
PRINT THIS ARTICLE
by Donald W. Pendergast, Jr.
Shares of the United States Natural Gas ETF (UNG) appear to be at a near-term top but within a longer term bullish framework.
Position: N/A
Donald W. Pendergast, Jr.
Freelance financial markets writer and online publisher of the Trendzetterz.com S&P 500 Weekly Forecast service.
PRINT THIS ARTICLE
MOVING AVERAGES
UNG: Recent Rally Produces Golden Cross
05/03/13 03:38:19 PMby Donald W. Pendergast, Jr.
Shares of the United States Natural Gas ETF (UNG) appear to be at a near-term top but within a longer term bullish framework.
Position: N/A
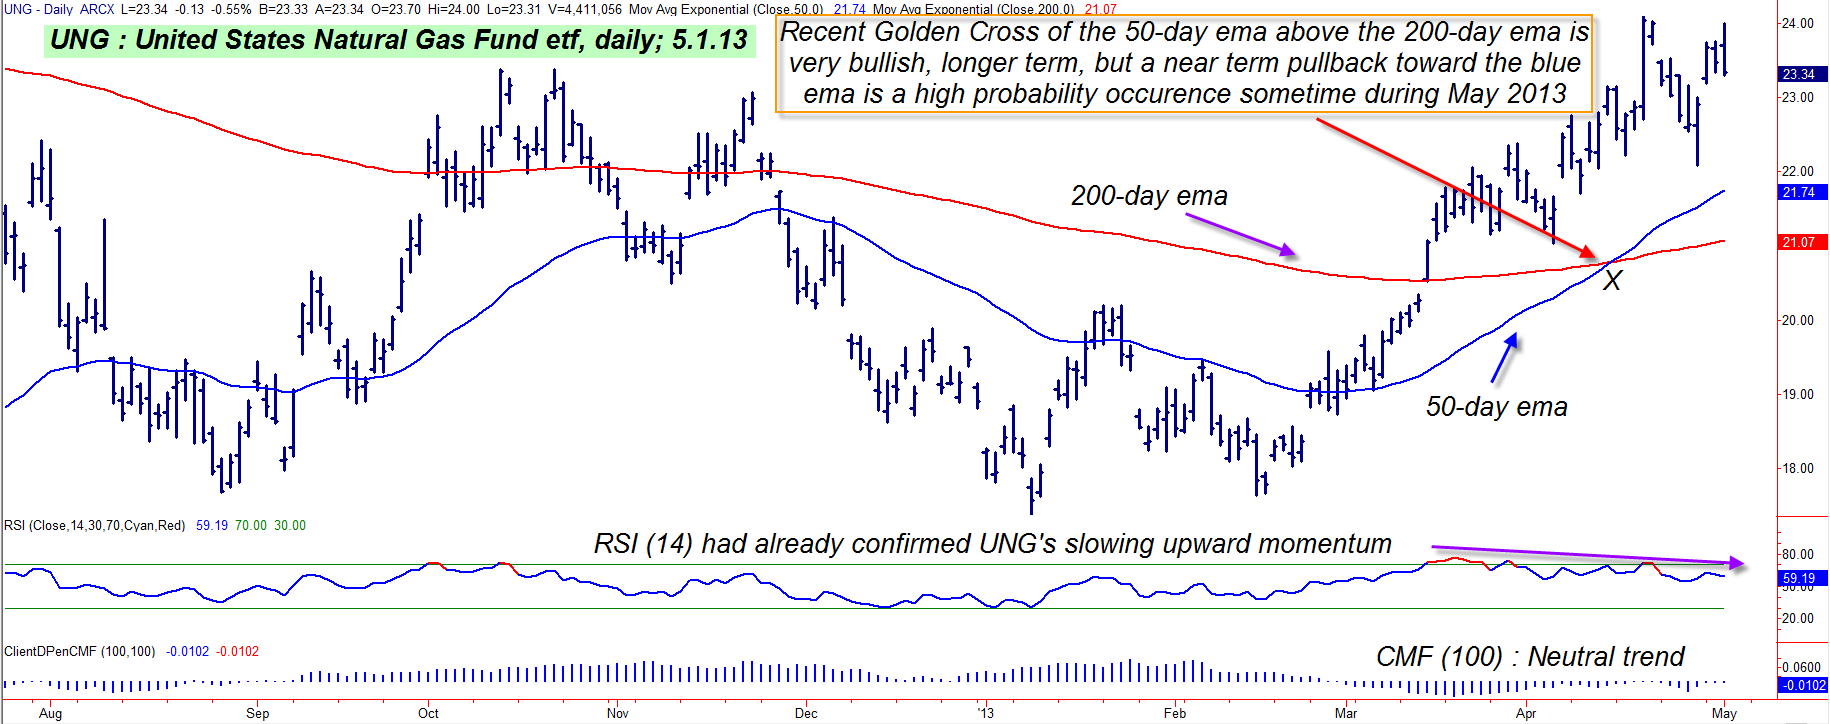
| Since bottoming in a major multicycle low in April 2012, the United States Natural Gas ETF (UNG) has only managed to recapture a tiny fraction of the losses it endured during a bear market that lasted nearly four years. Most traders clearly remember the manic rise in energy prices from late 2006 into early summer 2008, and at its peak, UNG was trading for $504.00 per share — before plummeting to a mind shattering $14.25 per share a little more than a year ago. That's a 97% decline, one of the worst ever recorded in any ETF over any time period. Currently trading at $23.32, UNG has tacked on nearly 64% in gains over the past 54 weeks and is now looking vulnerable to a pullback to one of its key support areas. Here's a closer look (Figure 1). |
|
| Figure 1. UNG's recent golden cross marks the first time in more than 21 months that its 50-day EMA has been above its 200-day EMA. Expect a near-term pullback towards the blue 50-day EMA, however. |
| Graphic provided by: TradeStation. |
| |
| The natural gas market has long been recognized to be one of the most volatile and unpredictable of all energy commodity markets, and for those traders who play the natural gas markets with shares of UNG, this certainly is no surprise. Those who used mechanical systems to short UNG since early July 2008 have probably done well, although the same systems would also have produced lots of losers most of the times UNG staged a feeble relief rally on the long slide southward. But that's all history now, and with the Spring 2012 lows looking like they may be "the" low for many more years to come, traders may now find that UNG will be just as good to trade from the long side as it is from the short side; the ETF has just completed a powerful rally on its daily chart — running from 17.65 up to 24.09 between mid-February and mid-April 2013 — and now looks as if it wants to do a proportional correction of that recent bull run. The first support level that will be widely watched is the 50-day exponential moving average (EMA), currently near $21.74. UNG recently experienced a "Golden Cross" of its 50-day EMA above its 200-day EMA on its daily chart, and that is usually interpreted as a bullish long-term signal by bulls; moving average crossovers are "lagging" indicators, however, and there is typically a pullback to either the 50- or 200-day EMA after such a bullish crossover — after which the long-term rally will resume, sometimes for many months before another big pullback. |
|
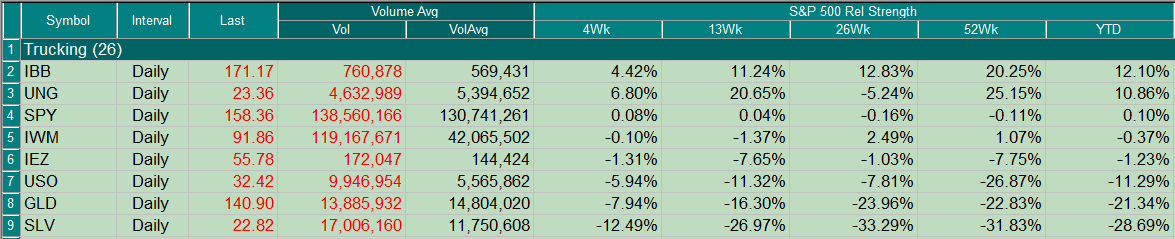
| Figure 2. The United States Natural Gas Fund (UNG) is up nearly 11% year-to-date, outperforming a wide variety of other ETFs. |
| Graphic provided by: TradeStation. |
| Graphic provided by: TradeStation Radar Screen. |
| |
| Look at a long-term daily or weekly chart of UNG and you'll notice another bullish pattern that may be forming — that of a large "saucer" pattern. Saucer patterns, if correctly identified early on, will typically lead to even larger scale gains for a stock in the months ahead. Right now, however, shorter term traders might want to play this high probability pullback in UNG like this: 1. On a decline below $23.30, short UNG, risking no more than 1% of your account value. 2. Place an initial buy to cover stop near $24.00 and then manage the position with a three bar trailing stop of the daily highs. 3. If the 50-day EMA (blue line) is reached, take profits on half of your position and let the rest run until final stop out or until the 200-day EMA (red line) is touched. Longer term traders interested in getting long UNG need to be patient and see if any of their daily-based mechanical trading systems issue any buy signals once UNG bounces higher from either of the two EMAs; if they do, and depending on how bullish you are, you may find these to be good swing trades (four to seven days holding period) or even great covered call plays using calls with four to six weeks of remaining time value. Golden crosses have very good predictive power of future rallies, but there is almost always a decent pullback to support shortly after the cross occurs, so learn to profit from this very reliable market dynamic, no matter what stocks or ETFs you like to trade. Trade wisely until we meet here again. |
Freelance financial markets writer and online publisher of the Trendzetterz.com S&P 500 Weekly Forecast service.
| Title: | Market consultant and writer |
| Company: | Trendzetterz |
| Address: | 81 Hickory Hollow Drive |
| Crossville, TN 38555 | |
| Phone # for sales: | 904-303-4814 |
| Website: | trendzetterz.com |
| E-mail address: | support@trendzetterz.com |
Traders' Resource Links | |
| Trendzetterz has not added any product or service information to TRADERS' RESOURCE. | |
Click here for more information about our publications!
Comments

Request Information From Our Sponsors
- StockCharts.com, Inc.
- Candle Patterns
- Candlestick Charting Explained
- Intermarket Technical Analysis
- John Murphy on Chart Analysis
- John Murphy's Chart Pattern Recognition
- John Murphy's Market Message
- MurphyExplainsMarketAnalysis-Intermarket Analysis
- MurphyExplainsMarketAnalysis-Visual Analysis
- StockCharts.com
- Technical Analysis of the Financial Markets
- The Visual Investor
- VectorVest, Inc.
- Executive Premier Workshop
- One-Day Options Course
- OptionsPro
- Retirement Income Workshop
- Sure-Fire Trading Systems (VectorVest, Inc.)
- Trading as a Business Workshop
- VectorVest 7 EOD
- VectorVest 7 RealTime/IntraDay
- VectorVest AutoTester
- VectorVest Educational Services
- VectorVest OnLine
- VectorVest Options Analyzer
- VectorVest ProGraphics v6.0
- VectorVest ProTrader 7
- VectorVest RealTime Derby Tool
- VectorVest Simulator
- VectorVest Variator
- VectorVest Watchdog