

HOT TOPICS LIST
- MACD
- Fibonacci
- RSI
- Gann
- ADXR
- Stochastics
- Volume
- Triangles
- Futures
- Cycles
- Volatility
- ZIGZAG
- MESA
- Retracement
- Aroon
INDICATORS LIST
LIST OF TOPICS
PRINT THIS ARTICLE
by Donald W. Pendergast, Jr.
Shares of Plains All American Pipeline are up by more than 30% since the end of 2012, but its rally may soon run out of gas.
Position: N/A
Donald W. Pendergast, Jr.
Freelance financial markets writer and online publisher of the Trendzetterz.com S&P 500 Weekly Forecast service.
PRINT THIS ARTICLE
TECHNICAL ANALYSIS
PAA: Heavy Distribution Evident
05/02/13 03:43:03 PMby Donald W. Pendergast, Jr.
Shares of Plains All American Pipeline are up by more than 30% since the end of 2012, but its rally may soon run out of gas.
Position: N/A
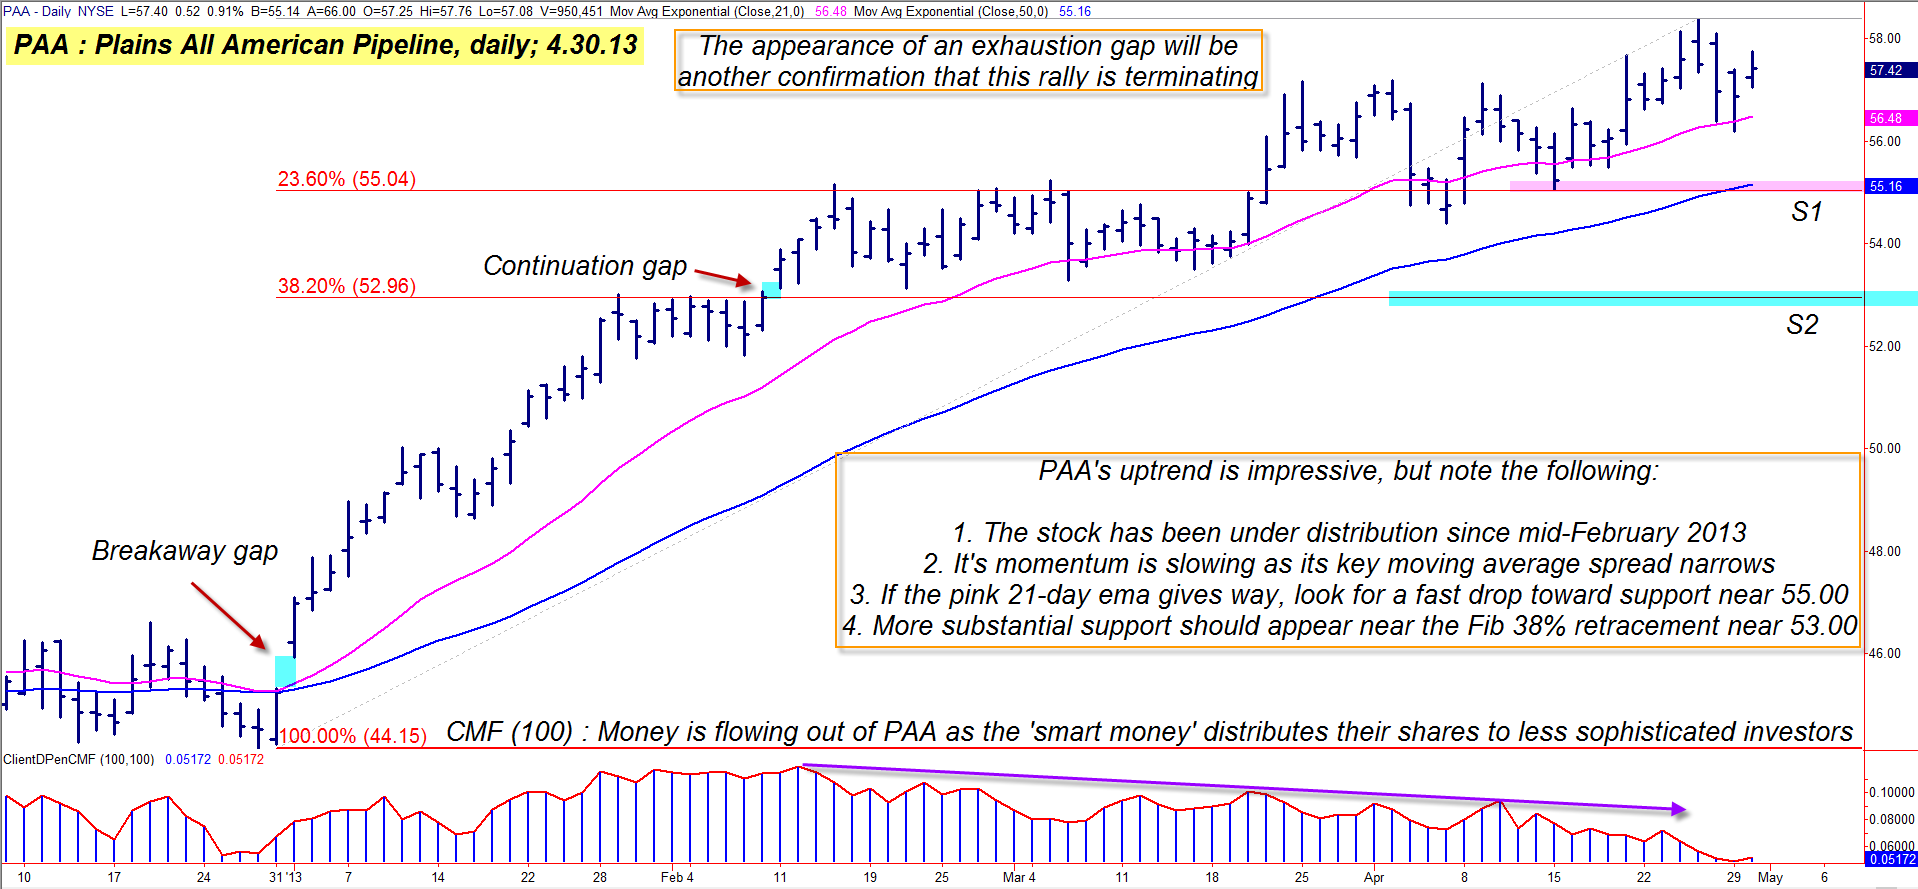
| Having surged higher by nearly 110% since the major stock market low of October 2011, shares of Plains All American Pipeline (PAA) are looking very ripe for a correction if not an all-out trend reversal. Here's a closer look now. |
|
| Figure 1. Slowing upward momentum and a bearish long-term money flow trend may be working together to precipitate a bearish trend reversal in shares of Plains All American Pipeline. |
| Graphic provided by: TradeStation. |
| |
| When energy sector stocks decide that it's time for a major rally, it's not uncommon to see certain stocks go into mammoth up trends; in particular, the stocks of companies in the oil services industry group can typically be counted on to mount strong trending moves several times each year, with sharp corrective/reversal moves occurring at the end of each one. If you want a steady diet of swing/trend trading action, the oil services stocks may just be your cup of tea. Take PAA, for example; it has been driven ever higher since the fall of 2011 by several of its major weekly and monthly price cycles, running steadily higher after each of its corrective and/or consolidation phases, far outperforming the S&P 500 index (.SPX) during the past 19 months. For the last two months, the stock has continued to chop higher in several volatile swings, even as its long-term money flow histogram (based on the 100-day Chaikin Money flow indicator (CMF(100))) has been confirming that PAA has been under steady distribution (the transfer of stock from the so-called "smart money" interests to the "dumb money" crowd) for the past 11 weeks (Figure 1). You see how the trend of the money flow histogram is ever lower even as PAA's price continues to rise, a sure tip off of distribution in most cases. And unless money flow starts rising again, it's only a matter of time until PAA begins to correct, seeking support at one or both of the support levels identified on the chart — S1 and S2 — once the stock makes a daily close below its 21-day exponential moving average (EMA). With the spread between PAA's 21- and 50-day EMA's continuing to narrow, we also have a solid technical confirmation that its upward momentum is decelerating; a drop below the pink 21-day EMA should lead to a fast drop toward S1, which is the combined support created by the blue 50-day EMA and the Fibonacci 24% support level of the entire rally from late December 2012. |
|
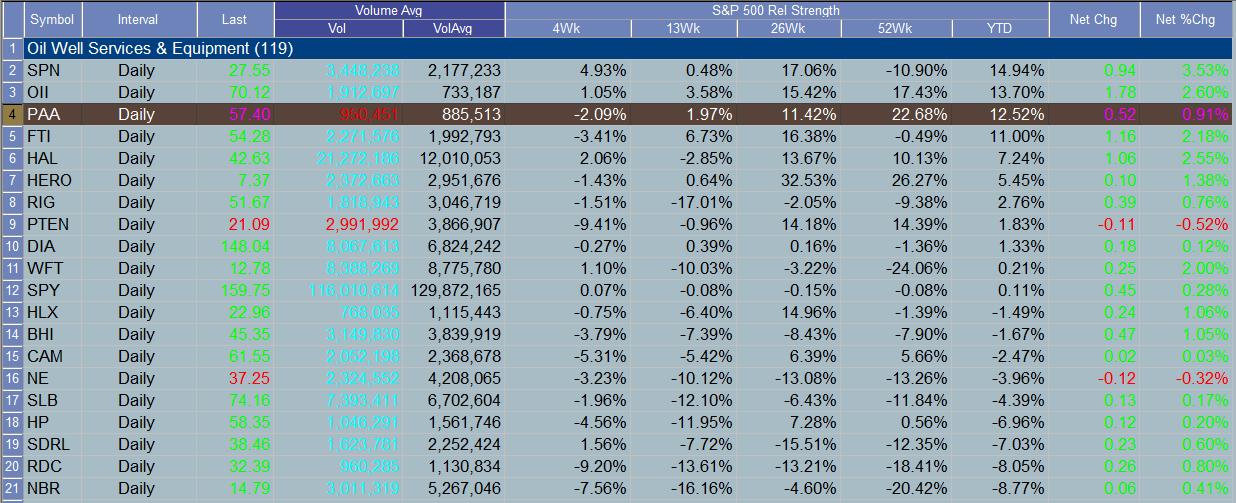
| Figure 2. PAA has been outperforming the .SPX over the past 13-, 26- and 52-week periods but is lagging the broad markets over the last four weeks. |
| Graphic provided by: TradeStation. |
| Graphic provided by: TradeStation Radar Screen. |
| |
| Skilled practitioners of technical analysis know that if a stock is destined for a major trend reversal, a pullback to the Fib 24% retracement is usually a short-lived affair, with more substantial declines soon to follow; with the clear evidence of distribution and slowing momentum now apparent, any reversal by PAA might become a great money making opportunity for skilled short sellers as they seek to capitalize on the potential for a decline to at least the Fib 50% support level near $53.00 before a sizable relief rally kicks in. Buying at-the-money put options looks like a good way to play the potential for a PAA reversal here: 1. Wait for PAA to close below its 21-day EMA. 2. On a further decline beneath the low of the bar that cleared the EMA, consider buying the August '13 PAA $57.50 put option. 3. Manage the position by selling the option if it doubles in price or if it declines in value by 50%. 4. On a decline to $54.00, consider taking profits on half of your position, trailing the rest. 5. If the S2 area is reached, consider closing out the balance of the trade. The $57.50 put has a decent bid/ask spread and open interest comes in at 131 contracts; time decay is only $1 per day/per contract and a fast drop in price by PAA should help pump up its value as its implied volatility rises. This looks like it could be a great near-term short play in PAA, no matter if you choose to play it by shorting stock or buying puts; remember to keep your account risk at 2% or less, no matter how bearish you may be on PAA or any other energy stocks at the moment. Trade wisely until we meet here again. |
Freelance financial markets writer and online publisher of the Trendzetterz.com S&P 500 Weekly Forecast service.
| Title: | Market consultant and writer |
| Company: | Trendzetterz |
| Address: | 81 Hickory Hollow Drive |
| Crossville, TN 38555 | |
| Phone # for sales: | 904-303-4814 |
| Website: | trendzetterz.com |
| E-mail address: | support@trendzetterz.com |
Traders' Resource Links | |
| Trendzetterz has not added any product or service information to TRADERS' RESOURCE. | |
Click here for more information about our publications!
PRINT THIS ARTICLE

Request Information From Our Sponsors
- StockCharts.com, Inc.
- Candle Patterns
- Candlestick Charting Explained
- Intermarket Technical Analysis
- John Murphy on Chart Analysis
- John Murphy's Chart Pattern Recognition
- John Murphy's Market Message
- MurphyExplainsMarketAnalysis-Intermarket Analysis
- MurphyExplainsMarketAnalysis-Visual Analysis
- StockCharts.com
- Technical Analysis of the Financial Markets
- The Visual Investor
- VectorVest, Inc.
- Executive Premier Workshop
- One-Day Options Course
- OptionsPro
- Retirement Income Workshop
- Sure-Fire Trading Systems (VectorVest, Inc.)
- Trading as a Business Workshop
- VectorVest 7 EOD
- VectorVest 7 RealTime/IntraDay
- VectorVest AutoTester
- VectorVest Educational Services
- VectorVest OnLine
- VectorVest Options Analyzer
- VectorVest ProGraphics v6.0
- VectorVest ProTrader 7
- VectorVest RealTime Derby Tool
- VectorVest Simulator
- VectorVest Variator
- VectorVest Watchdog