HOT TOPICS LIST
- MACD
- Fibonacci
- RSI
- Gann
- ADXR
- Stochastics
- Volume
- Triangles
- Futures
- Cycles
- Volatility
- ZIGZAG
- MESA
- Retracement
- Aroon
INDICATORS LIST
LIST OF TOPICS
PRINT THIS ARTICLE
by Koos van der Merwe
Yes, three-dimensional printing sounds like something out of a science fiction novel. Is it going to change the world? Should you buy the stock now?
Position: Sell
Koos van der Merwe
Has been a technical analyst since 1969, and has worked as a futures and options trader with First Financial Futures in Johannesburg, South Africa.
PRINT THIS ARTICLE
ELLIOTT WAVE
3-D Printing
05/01/13 04:53:27 PMby Koos van der Merwe
Yes, three-dimensional printing sounds like something out of a science fiction novel. Is it going to change the world? Should you buy the stock now?
Position: Sell
| These are the very early days of 3D printing. The devices are still being developed and improved on, but let's face it — the technology is more than interesting. There is no doubt that the 3D machine that can read a design and lay down successive layers of liquid, powder, or sheet material to build the model three dimensionally is worth looking at, especially as it starts gathering everyone's attention. Three companies that are attracting attention are 3D Systems Corp (DDD), StrataSys Inc. (SSYS) and Proto Labs Inc (PRLB). I shall look at all three companies on a weekly basis. |

|
| Figure 1. Weekly chart of 3D Systems Corp |
| Graphic provided by: AdvancedGET. |
| |
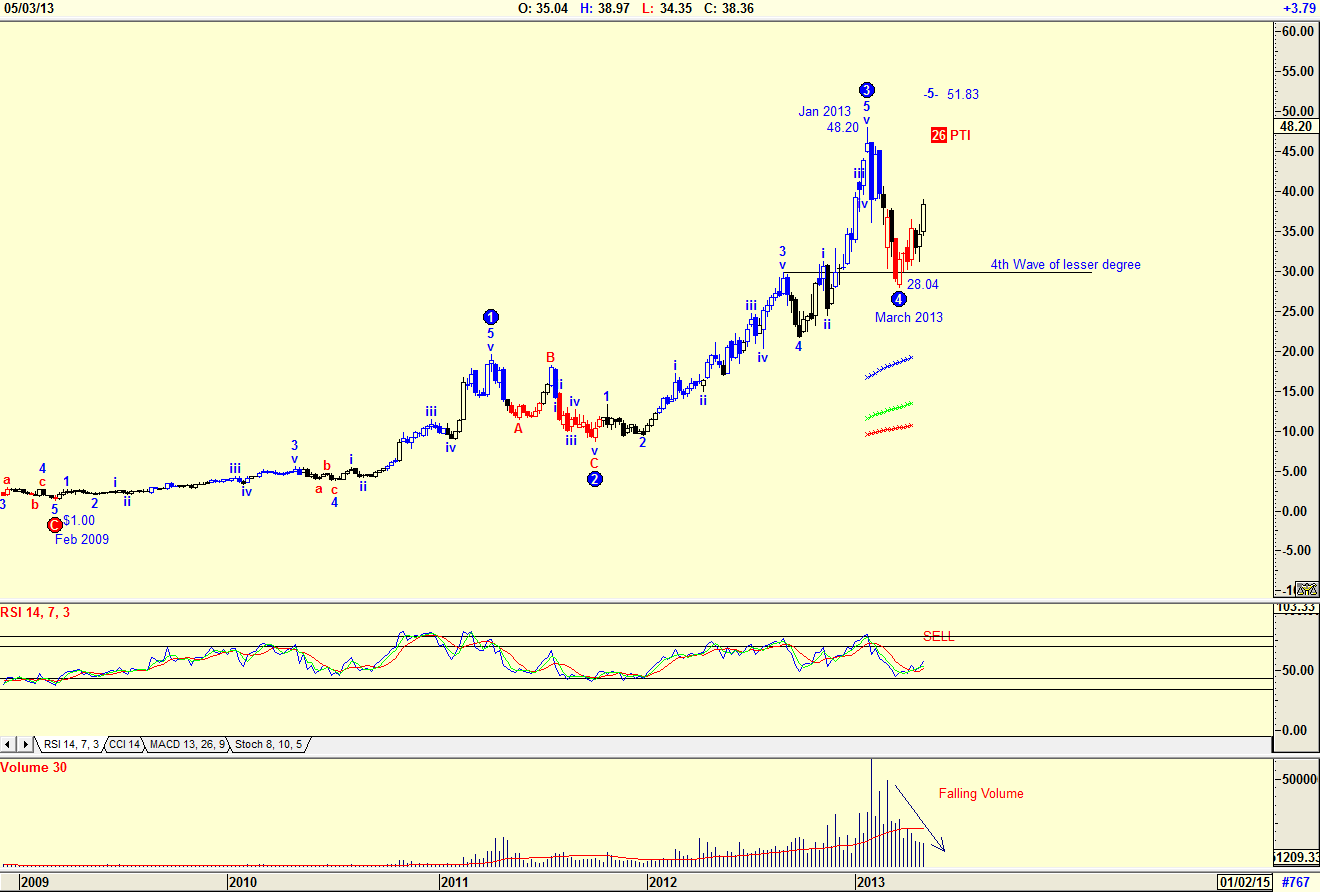
| The chart in Figure 1 is a weekly chart of DDD. The chart shows how the share price rose from a low of $1.00 in February 2009 to a high of $48.20 by January 2013. The Advanced GET Elliott Wave count is suggesting that the rise has been in a WAVE 3 and that the share price has completed a WAVE 4 correction to $28.04 by March 2013. The fall in price has been confirmed by the RSI indicator which gave a sell signal, and is trending down. The falling volume as the price fell, and the falling volume as the price rose from March 2013, however, is suggesting that the WAVE 4 may possibly not be complete. The probability index of 26 shown on the chart is also suggesting that the WAVE 5 target of $51.83 may not happen. Wave 4 did fall to the 4th Wave of lesser degree, suggesting that the WAVE 4 could indeed be genuine. I would, however, be inclined to wait for another correction down possibly to test the WAVE 4 low at $28.04 before buying. |

|
| Figure 2. Weekly chart of Proto Labs Inc |
| Graphic provided by: AdvancedGET. |
| |
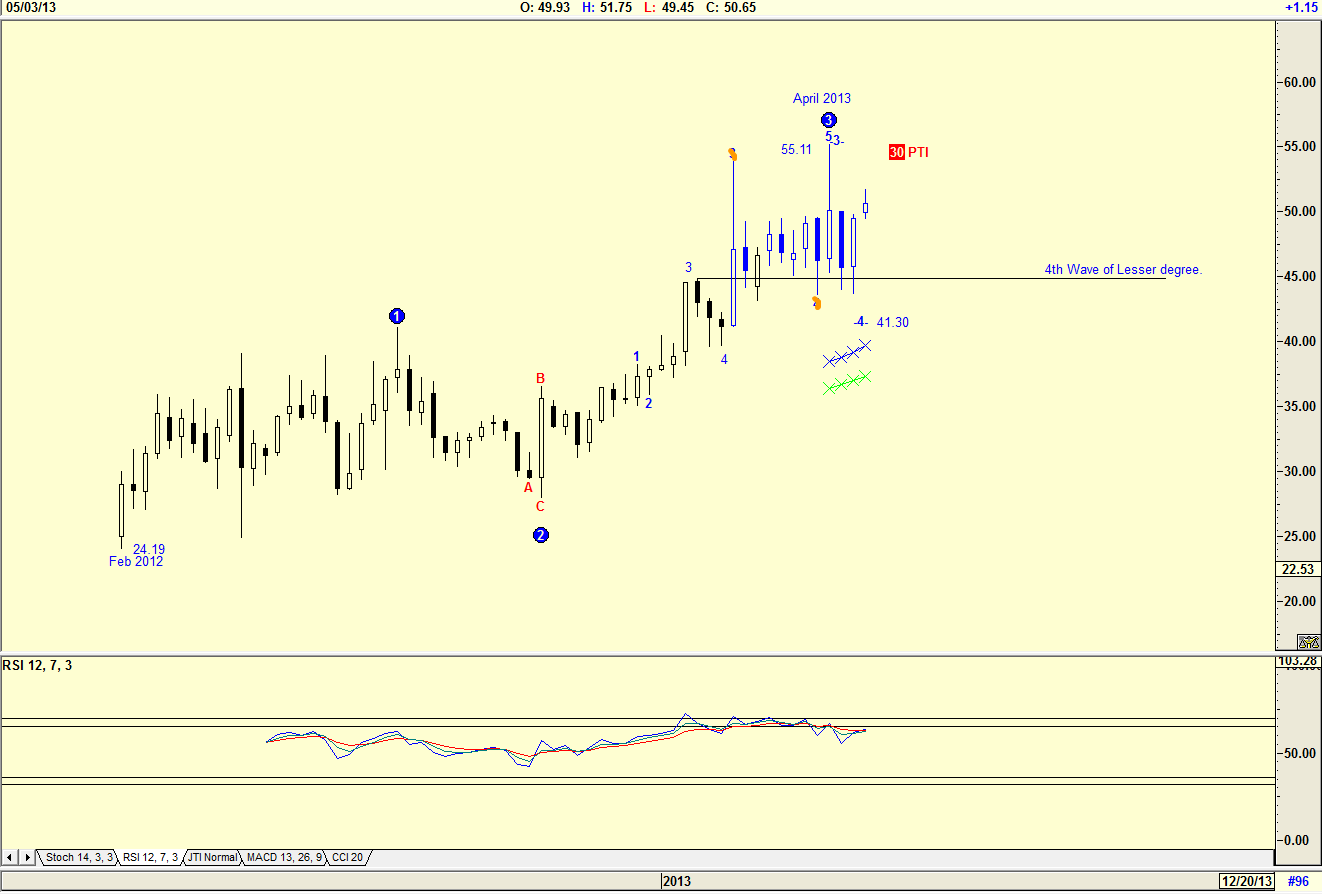
| The chart in Figure 2 is a weekly chart of PRLB, which has risen from a low of $24.19 on February 2012 to a high of $55.11 by April 2013. The Advanced GET Elliott Wave count is suggesting that the price could fall in a WAVE 4 correction to $41.30. The probability index (PTI) is suggesting a 30% probability; however anything less than 32% should be in doubt. The RSI is suggesting weakness so the chances of a fall to $41.30 could happen. The WAVE 4 suggested is within the 4th wave of lesser degree. |

|
| Figure 3 Weekly chart of StrataSys Inc |
| Graphic provided by: AdvancedGET. |
| |
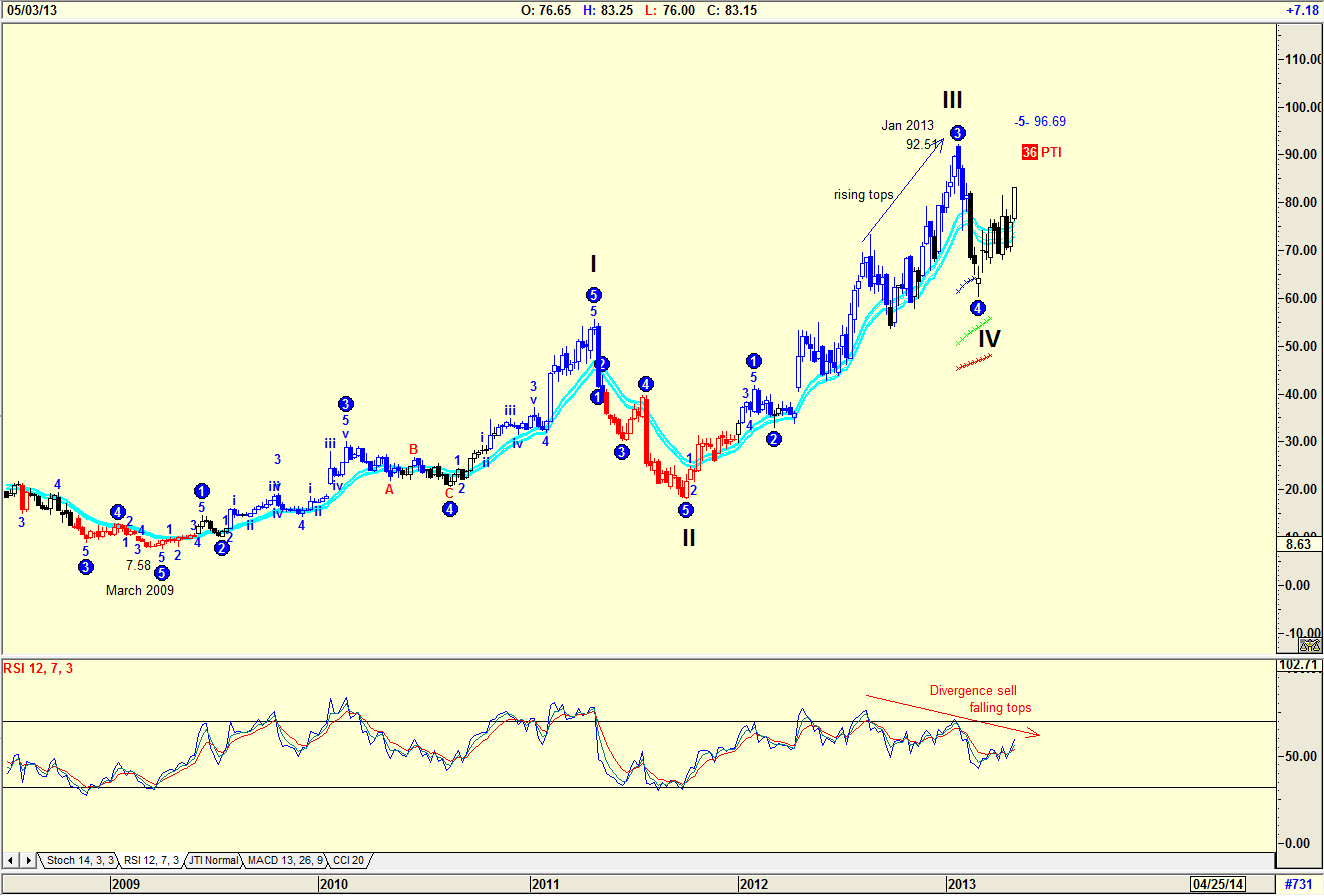
| The weekly chart in Figure 3 is a chart of SSYS. The Advanced GET Elliott Wave count is suggesting that the price could rise to $96.69 in a Wave 5 of a WAVE V. The chart also shows how the price has risen strongly from a low of $7.58 in March 2009 to a high of $92.51 by January 2013. The RSI indicator has given a divergence sell signal. This is where the stock price shows rising tops, while the RSI indicator shows falling tops. Yes, the technology of three-dimensional printing is fascinating, and sounds like something out of a science fiction story. And yes, I would have liked to be one of the initial investors in 2009 in any one of the above companies, but the technology was hardly known then, except to the technology expert investors. I would like to be a buyer of any one of the above companies in the future, so I shall be watching them carefully, looking at the daily chart to pick a buy point when the weekly chart gives me a definite buy signal. These are definitely three companies to watch. |
Has been a technical analyst since 1969, and has worked as a futures and options trader with First Financial Futures in Johannesburg, South Africa.
| Address: | 3256 West 24th Ave |
| Vancouver, BC | |
| Phone # for sales: | 6042634214 |
| E-mail address: | petroosp@gmail.com |
Click here for more information about our publications!
Comments
Date: 05/03/13Rank: 5Comment:

Request Information From Our Sponsors
- StockCharts.com, Inc.
- Candle Patterns
- Candlestick Charting Explained
- Intermarket Technical Analysis
- John Murphy on Chart Analysis
- John Murphy's Chart Pattern Recognition
- John Murphy's Market Message
- MurphyExplainsMarketAnalysis-Intermarket Analysis
- MurphyExplainsMarketAnalysis-Visual Analysis
- StockCharts.com
- Technical Analysis of the Financial Markets
- The Visual Investor
- VectorVest, Inc.
- Executive Premier Workshop
- One-Day Options Course
- OptionsPro
- Retirement Income Workshop
- Sure-Fire Trading Systems (VectorVest, Inc.)
- Trading as a Business Workshop
- VectorVest 7 EOD
- VectorVest 7 RealTime/IntraDay
- VectorVest AutoTester
- VectorVest Educational Services
- VectorVest OnLine
- VectorVest Options Analyzer
- VectorVest ProGraphics v6.0
- VectorVest ProTrader 7
- VectorVest RealTime Derby Tool
- VectorVest Simulator
- VectorVest Variator
- VectorVest Watchdog
