

HOT TOPICS LIST
- MACD
- Fibonacci
- RSI
- Gann
- ADXR
- Stochastics
- Volume
- Triangles
- Futures
- Cycles
- Volatility
- ZIGZAG
- MESA
- Retracement
- Aroon
INDICATORS LIST
LIST OF TOPICS
PRINT THIS ARTICLE
by Matt Blackman
Since bottoming in late 2008 a few tech giants have for the most part led the market. But this leadership began to break down in 2013. Does it signal a changing of the guard?
Position: N/A
Matt Blackman
Matt Blackman is a full-time technical and financial writer and trader. He produces corporate and financial newsletters, and assists clients in getting published in the mainstream media. He is the host of TradeSystemGuru.com. Matt has earned the Chartered Market Technician (CMT) designation. Find out what stocks and futures Matt is watching on Twitter at www.twitter.com/RatioTrade
PRINT THIS ARTICLE
Four Market Leaders Under Pressure But For How Long?
05/01/13 04:49:00 PMby Matt Blackman
Since bottoming in late 2008 a few tech giants have for the most part led the market. But this leadership began to break down in 2013. Does it signal a changing of the guard?
Position: N/A
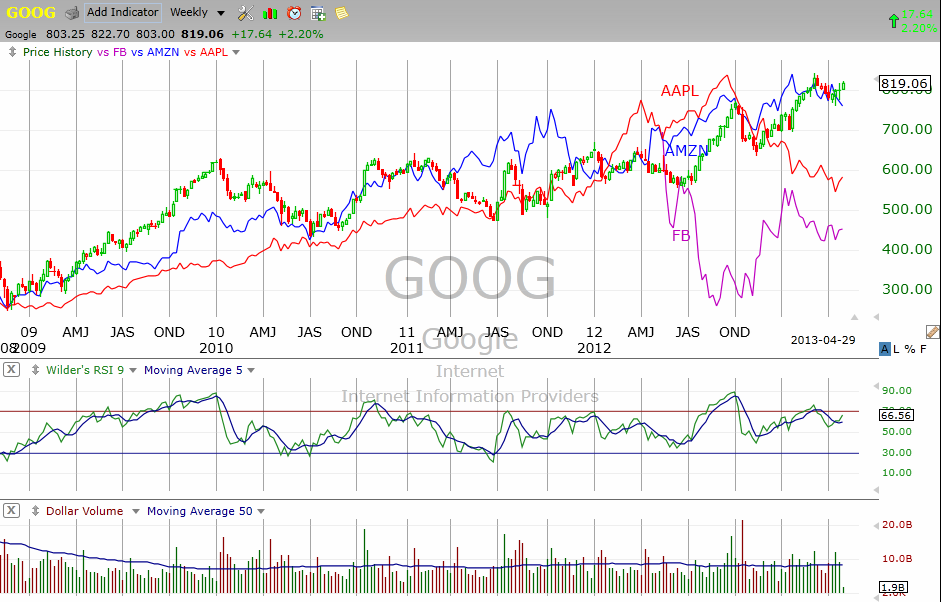
| By the time the S&P500 had bottomed in 2009, technology bellwethers Google (GOOG), Apple (AAPL), and Amazon (AMZN) had already begun strong rallies having bottomed in November/December 2008. To say it was a good place to be invested was the understatement of the decade and by the end of 2012 GOOG had nearly tripled while AMZN and AAPL had roughly quadrupled in price. Facebook (FB) wouldn't become tradable until later with its IPO in 2012. And although it disappointed out of the gate, I am including it since so many have made bets that it would eventually join the tech leaders' pack. |
|
| Figure 1 � Weekly chart of Apple (AAPL), Amazon (AMZN), Google (GOOG) and Facebook (FB) showing how the first three rocketed off the bottom in 2008 and pulled the market higher. |
| Graphic provided by: TC2000.com. |
| |
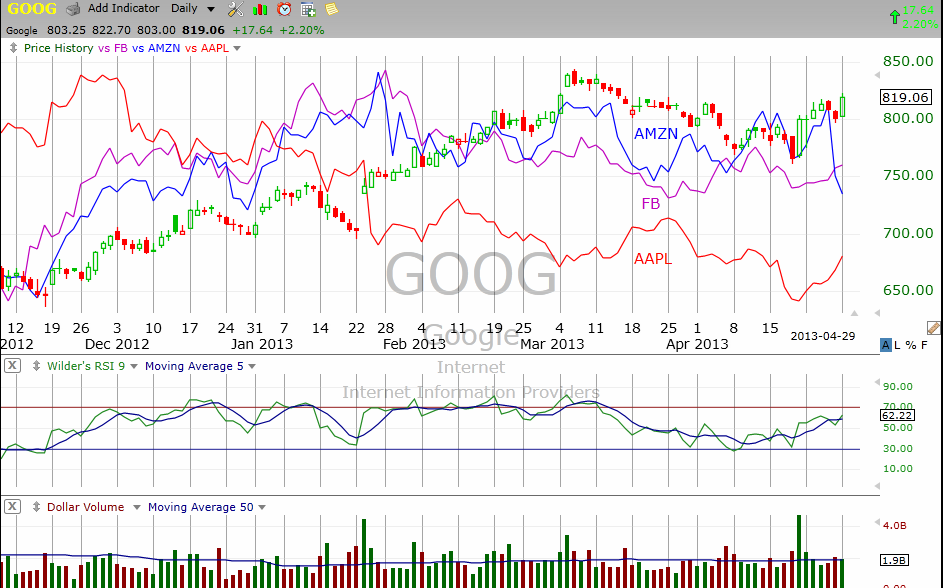
| Now compare the rosy picture over the longer-term in Figure 1 with the recent chaos in Figure 2. With the exception of GOOG, which remained in an uptrend until March, AMZN and especially AAPL have struggled. And FB, which was the most hyped IPO in history, still has more than 40% to go just to get back to where it was on its first trading day. What lessons can we take from this? FB has made a valiant attempt to claw its way back up the chart and given its current trajectory, has a chance to get back into the $30 range in the next month or so barring any unforeseen corrections. Since posting better than expected earnings, announcing a stock buyback and dividend, AAPL has moved back into the low $400 range. It faces major overhead volume resistance from $430 to $470 but if it can maintain momentum, it could be trading above $500 by June or July, again barring the unexpected. The jury is still out on AMZN, which had disappointing earnings and has seen its margins shrink to near invisibility, which, based on its chart, has many traders concerned for its future. |
|
| Figure 2 � The daily chart from November 2012 shows a much different picture of confusion and uncertainty. |
| Graphic provided by: TC2000.com. |
| |
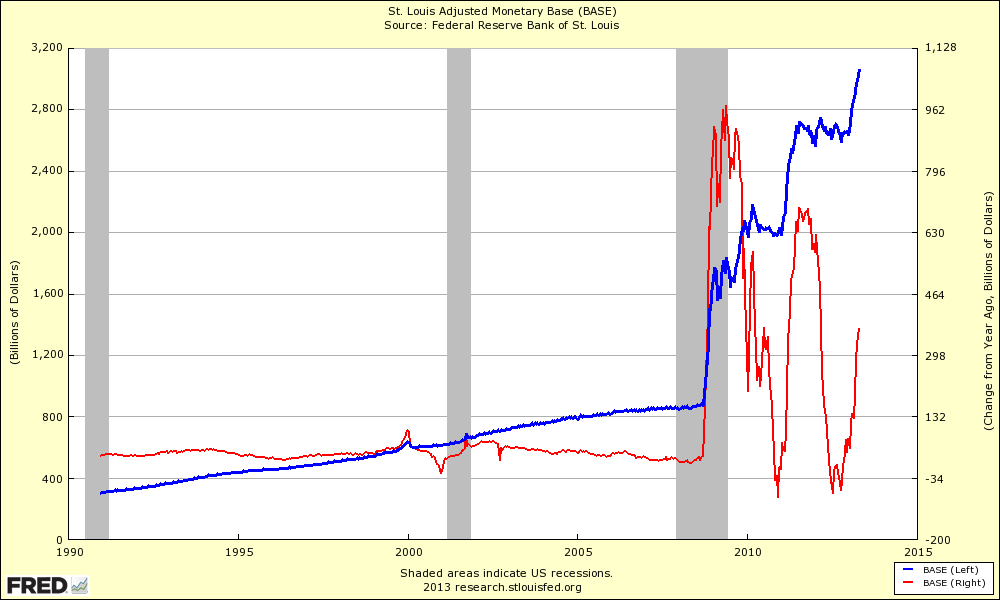
| From an intermarket analysis perspective, that technology stocks are struggling is a bearish omen for markets since techs lead in the early to mid-stages of a rally. Once they stop leading, it is often only a matter of time before the rest of the market follows. Another concern is the impact that the growing Federal Reserve balance sheet has had on stocks and given that techs responded first to trillions in stimulus, they are likely to be the most vulnerable to any attempts to shrink the balance sheet, which is why I am keeping a close watch on the rate of change data from by the St. Louis Federal Reserve (see Figure 3). |
|
| Figure 3 � Data from the St Louis Federal Reserve comparing the Adjusted Monetary Base or AMB (blue, left-hand scale) with the rate of change in billions$ from the year prior (red, right hand scale). Note how quickly the AMB is expanding at a rate of more than $300 billion per year as of the latest data on April 17. |
| Graphic provided by: St. Louis Federal Reserve. |
| |
| So why has the Fed revved the printing presses lately? Clearly the Fed is very concerned about weakness in stocks ahead. Surely they can't still believe it will help the economy given all the data that has been published to the contrary? From a stock perspective, the explosion in AMB has to be the biggest stock price impetus and may explain the strength in GOOG, AAPL, and FB lately. But these stocks are equally vulnerable to a sell off should the AMB begin to reverse or some other event scares investors. |
Matt Blackman is a full-time technical and financial writer and trader. He produces corporate and financial newsletters, and assists clients in getting published in the mainstream media. He is the host of TradeSystemGuru.com. Matt has earned the Chartered Market Technician (CMT) designation. Find out what stocks and futures Matt is watching on Twitter at www.twitter.com/RatioTrade
| Company: | TradeSystemGuru.com |
| Address: | Box 2589 |
| Garibaldi Highlands, BC Canada | |
| Phone # for sales: | 604-898-9069 |
| Fax: | 604-898-9069 |
| Website: | www.tradesystemguru.com |
| E-mail address: | indextradermb@gmail.com |
Traders' Resource Links | |
| TradeSystemGuru.com has not added any product or service information to TRADERS' RESOURCE. | |
Click here for more information about our publications!
Comments

Request Information From Our Sponsors
- StockCharts.com, Inc.
- Candle Patterns
- Candlestick Charting Explained
- Intermarket Technical Analysis
- John Murphy on Chart Analysis
- John Murphy's Chart Pattern Recognition
- John Murphy's Market Message
- MurphyExplainsMarketAnalysis-Intermarket Analysis
- MurphyExplainsMarketAnalysis-Visual Analysis
- StockCharts.com
- Technical Analysis of the Financial Markets
- The Visual Investor
- VectorVest, Inc.
- Executive Premier Workshop
- One-Day Options Course
- OptionsPro
- Retirement Income Workshop
- Sure-Fire Trading Systems (VectorVest, Inc.)
- Trading as a Business Workshop
- VectorVest 7 EOD
- VectorVest 7 RealTime/IntraDay
- VectorVest AutoTester
- VectorVest Educational Services
- VectorVest OnLine
- VectorVest Options Analyzer
- VectorVest ProGraphics v6.0
- VectorVest ProTrader 7
- VectorVest RealTime Derby Tool
- VectorVest Simulator
- VectorVest Variator
- VectorVest Watchdog