

HOT TOPICS LIST
- MACD
- Fibonacci
- RSI
- Gann
- ADXR
- Stochastics
- Volume
- Triangles
- Futures
- Cycles
- Volatility
- ZIGZAG
- MESA
- Retracement
- Aroon
INDICATORS LIST
LIST OF TOPICS
PRINT THIS ARTICLE
by Donald W. Pendergast, Jr.
Since bottoming out on February 25, 2013, shares of Ford Motor (F) have begun to trace out a pattern of higher highs and higher lows.
Position: N/A
Donald W. Pendergast, Jr.
Freelance financial markets writer and online publisher of the Trendzetterz.com S&P 500 Weekly Forecast service.
PRINT THIS ARTICLE
TECHNICAL ANALYSIS
Ford Motor: Short-Term High Approaching?
04/30/13 03:45:36 PMby Donald W. Pendergast, Jr.
Since bottoming out on February 25, 2013, shares of Ford Motor (F) have begun to trace out a pattern of higher highs and higher lows.
Position: N/A
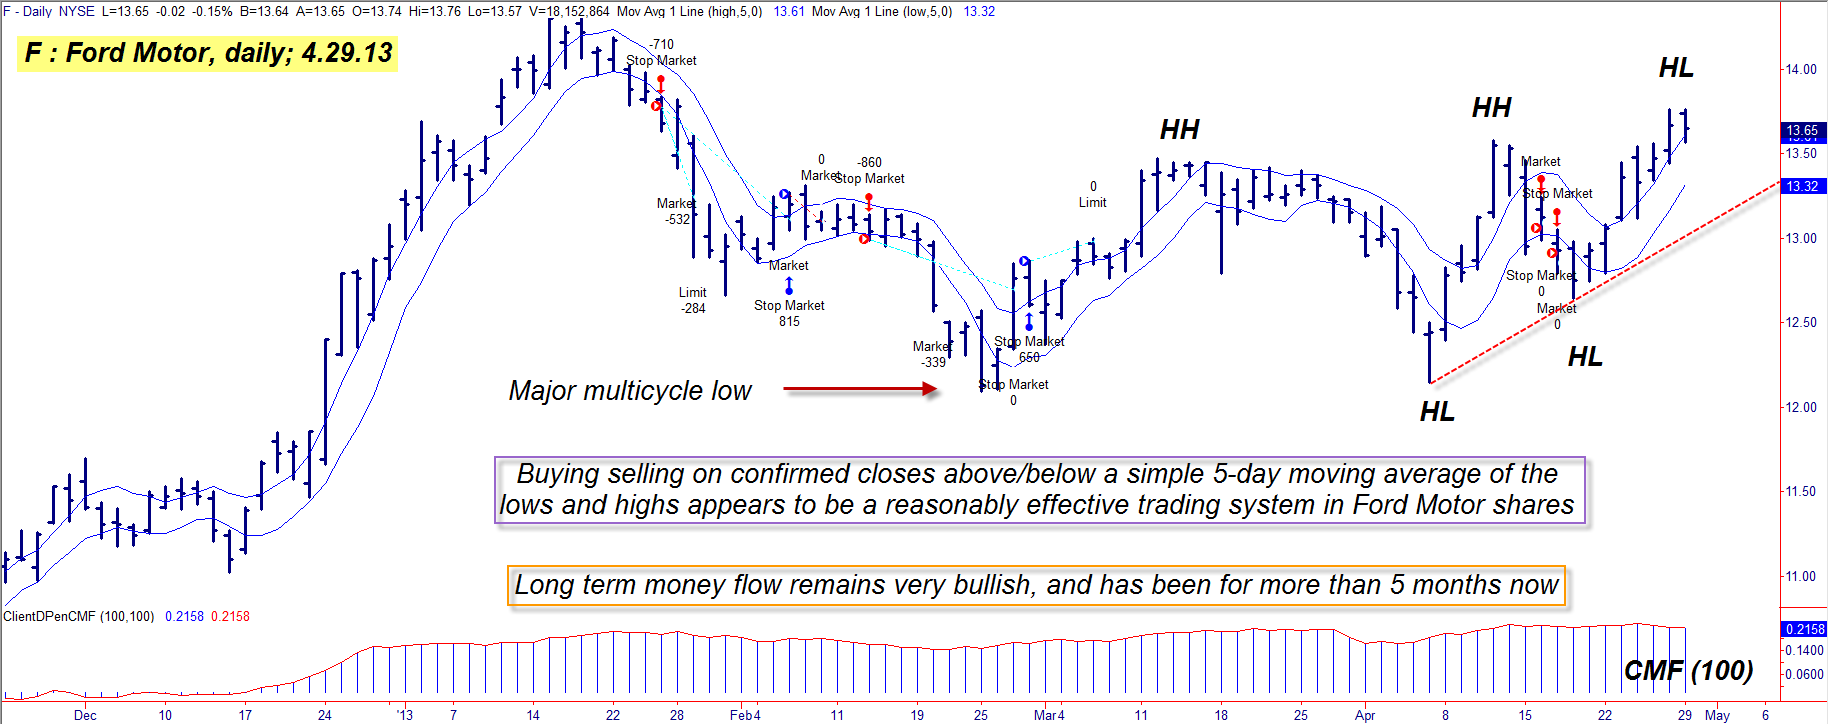
| Ford Motor (F) shares, although technically in an uptrend since making a significant multicycle low nine weeks ago, really hasn't gained much ground since then, rising by only about 12%. Its current pattern, however, is possibly a precursor to a much larger continuation-style move, one that could be an extension of its previous bullish rampage when it soared 62% between August 2012 and January 2013. Here's a closer look. |
|
| Figure 1: While Ford shares are only up by 12% since the major February 2013 low, its upward momentum is increasing even as the "smart money" continues to accumulate shares. |
| Graphic provided by: TradeStation. |
| |
| For a large cap stock, shares of F are one of the better equities for trend-following traders to deal in; looking at its daily chart in Figure 1, trading history reveals that it tends to go on two to three powerful trends every calendar year, and that even many of its smaller-scale swing moves are still very tradable, and potentially profitable. In fact, one of the simplest trading systems you can apply to a daily price chart of F is that of a simple moving average of the daily highs and lows; this forms an "envelope" around the stock, with closes beyond the envelope triggering mechanical buy/sell signals as part of a "stop and reverse" methodology. It's a simple system, but one that appears to back test with decent profitability in the stock over a long period of time, particularly when traded in the direction of its 50- or 200-day exponential moving average (EMA). As far as other key technicals go, consider that: 1. F is in a defacto uptrend — which is defined as a series of higher highs (HH) and higher lows (HL). 2. Long-term money flow, as defined by its 100-day Chaikin Money flow histogram (CMF(100)) remains in extremely bullish posture, indicating that the so-called "smart money" interests in the stock market are still actively accumulating shares of F. |
|
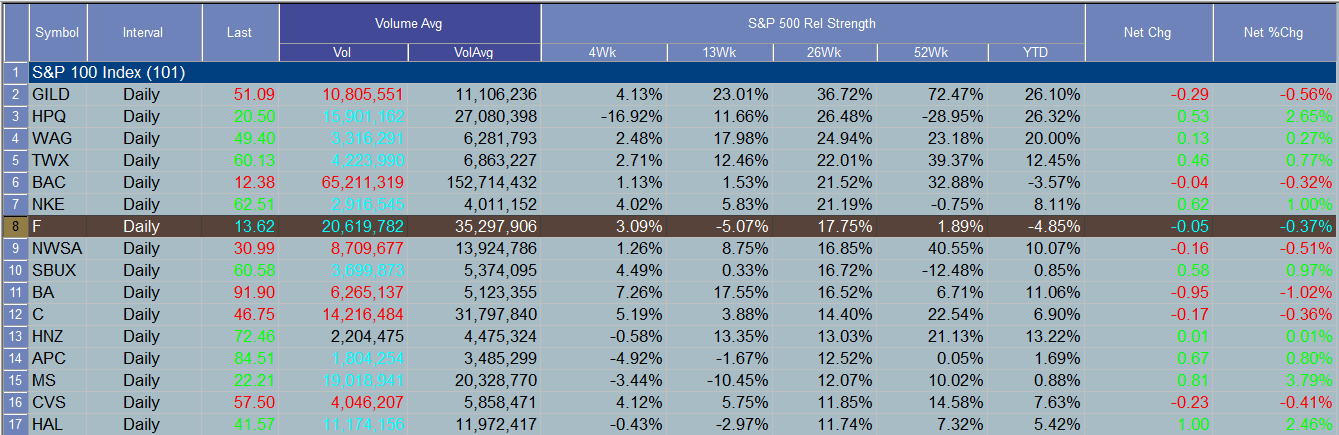
| Figure 2: Ford Motor is one of the better performing S&P 100 (.OEX) stocks during the past 26 weeks. |
| Graphic provided by: TradeStation. |
| Graphic provided by: TradeStation Radar Screen. |
| |
| Currently, F is in a hypothetical long trade, one triggered at the open on April 23, 2013 at a price of 13.12. Depending on whether a trader uses a real time cross of the lower moving average or a daily close below the average as the exit trigger, this trade is also likely to be a winner; of course, a trader could also take partial profits once a 2% profit target is achieved, trailing the rest of the position. Traders who are truly convinced that F is soon going to mount a run-up towards the January 2013 highs of 14.3 may also want to consider putting on a covered call (CC) trade, one that uses a 21-day EMA. One interesting CC trade uses the June '13 F $13.00 call option; the bid-ask spread is only two cents and the option's open interest figure is a whopping 26,398 contracts. The 21-day EMA is currently at 13.21 and will serve as a fairly low risk trailing stop that requires zero intraday monitoring; if F closes below the EMA, simply close the trade out and if the stock keeps on grinding higher, just hold it until equity options expiration on the third Friday of June 2013. |
| The bottom line here is that Ford shares are continuing to scramble higher in an attempt to meet/exceed the January 2013 high of 14.30. Shorter term swing traders can use the simple mechanical system described earlier, while those willing to hold for a longer time period may find the covered call route to be right up their alley. As always, limit your trade risk on this or any other trade to 2% or less of your account value, no matter how bullish you may be on F at the moment. Trade wisely until we meet here again. |
Freelance financial markets writer and online publisher of the Trendzetterz.com S&P 500 Weekly Forecast service.
| Title: | Market consultant and writer |
| Company: | Trendzetterz |
| Address: | 81 Hickory Hollow Drive |
| Crossville, TN 38555 | |
| Phone # for sales: | 904-303-4814 |
| Website: | trendzetterz.com |
| E-mail address: | support@trendzetterz.com |
Traders' Resource Links | |
| Trendzetterz has not added any product or service information to TRADERS' RESOURCE. | |
Click here for more information about our publications!
Comments

Request Information From Our Sponsors
- StockCharts.com, Inc.
- Candle Patterns
- Candlestick Charting Explained
- Intermarket Technical Analysis
- John Murphy on Chart Analysis
- John Murphy's Chart Pattern Recognition
- John Murphy's Market Message
- MurphyExplainsMarketAnalysis-Intermarket Analysis
- MurphyExplainsMarketAnalysis-Visual Analysis
- StockCharts.com
- Technical Analysis of the Financial Markets
- The Visual Investor
- VectorVest, Inc.
- Executive Premier Workshop
- One-Day Options Course
- OptionsPro
- Retirement Income Workshop
- Sure-Fire Trading Systems (VectorVest, Inc.)
- Trading as a Business Workshop
- VectorVest 7 EOD
- VectorVest 7 RealTime/IntraDay
- VectorVest AutoTester
- VectorVest Educational Services
- VectorVest OnLine
- VectorVest Options Analyzer
- VectorVest ProGraphics v6.0
- VectorVest ProTrader 7
- VectorVest RealTime Derby Tool
- VectorVest Simulator
- VectorVest Variator
- VectorVest Watchdog