HOT TOPICS LIST
- MACD
- Fibonacci
- RSI
- Gann
- ADXR
- Stochastics
- Volume
- Triangles
- Futures
- Cycles
- Volatility
- ZIGZAG
- MESA
- Retracement
- Aroon
INDICATORS LIST
LIST OF TOPICS
PRINT THIS ARTICLE
by David Penn
Up from a November 2001 low of 19, crude oil has gained over 57%. Does an upside triangle breakout mean there's even higher ground ahead?
Position: N/A
David Penn
Technical Writer for Technical Analysis of STOCKS & COMMODITIES magazine, Working-Money.com, and Traders.com Advantage.
PRINT THIS ARTICLE
ASCENDING TRIANGLES
Crude Oil's Ascending Triangle
08/20/02 12:17:43 PMby David Penn
Up from a November 2001 low of 19, crude oil has gained over 57%. Does an upside triangle breakout mean there's even higher ground ahead?
Position: N/A
| A few weeks ago, a popular political commentator observing the events in the Middle East and around the world, suggested that crude oil prices could either hit $6 per barrel or $60, depending on what policies the United States and a host of other nations took over the balance of this year. At this point in time, both extremes appear unreachable, but the current advance of crude oil, now up 43% year-to-date and nearing $30 a barrel, has gotten the attention of traders. |
| For a period of time, it appeared as if crude oil -- like the rest of the petroleum futures -- had topped. In fact, I had earlier suggested that crude oil, heating oil and unleaded gasoline all appeared to be developing head and shoulders tops at the top of their spring advances (see "Petroleum's Head and Shoulders Complex," Traders.com Advantage, July 24, 2002). However, even at the time I noted that unleaded gas and crude oil had failed to break down in mid-July as anticipated, and instead set new contract highs before the month was over. |

|
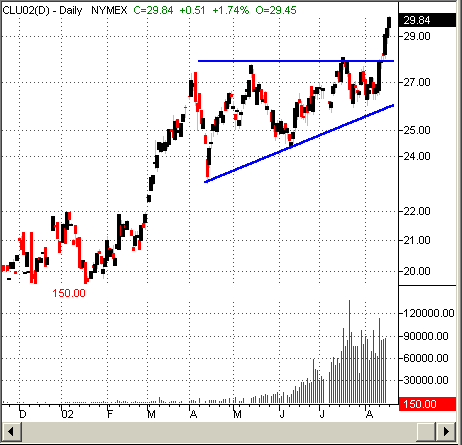
| Crude oil prices may be high, but this ascending triangle look likely to take prices even higher. |
| Graphic provided by: MetaStock. |
| |
| Additionally, the trough lows in the potential head and shoulders patterns in the petroleum futures were higher in June than the ones in April, making for an "upward" head and shoulders top. This means the uptrend was still in place -- even as the trend stopped making new highs. In fact, the combination of higher lows and relatively constant highs is precisely what appears to have set up the ascending triangles in the petroleum futures -- most notably in crude oil. |
| Looking at the September crude contract, we can see the low point at the beginning of the ascending triangle was the April low at about 23. Rallies after this point appear to top out and run into resistance around 28; the May and July rally peaks are at 27.75 and 28.05 respectively. The low between these two peaks is the June low of 24.30. Again, higher lows and relatively constant highs in a consolidation at the end of an uptrend usually suggest an ascending triangle, a bullish continuation formation. |
| Given the size of the ascending triangle, we can posit a likely minimum price target of 33. This is determined by subtracting the lowest value in the triangle (the April low of 23) from the highest value in the triangle (the July rally peak of 28.05) to get a formation size and adding that number to the highest value in the triangle. Thus, with a formation size of about 5, we arrive at a minimum target of 33 for September crude -- and a little more room to run for the bulls. |
Technical Writer for Technical Analysis of STOCKS & COMMODITIES magazine, Working-Money.com, and Traders.com Advantage.
| Title: | Technical Writer |
| Company: | Technical Analysis, Inc. |
| Address: | 4757 California Avenue SW |
| Seattle, WA 98116 | |
| Phone # for sales: | 206 938 0570 |
| Fax: | 206 938 1307 |
| Website: | www.Traders.com |
| E-mail address: | DPenn@traders.com |
Traders' Resource Links | |
| Charting the Stock Market: The Wyckoff Method -- Books | |
| Working-Money.com -- Online Trading Services | |
| Traders.com Advantage -- Online Trading Services | |
| Technical Analysis of Stocks & Commodities -- Publications and Newsletters | |
| Working Money, at Working-Money.com -- Publications and Newsletters | |
| Traders.com Advantage -- Publications and Newsletters | |
| Professional Traders Starter Kit -- Software | |
Click here for more information about our publications!
Comments

Request Information From Our Sponsors
- StockCharts.com, Inc.
- Candle Patterns
- Candlestick Charting Explained
- Intermarket Technical Analysis
- John Murphy on Chart Analysis
- John Murphy's Chart Pattern Recognition
- John Murphy's Market Message
- MurphyExplainsMarketAnalysis-Intermarket Analysis
- MurphyExplainsMarketAnalysis-Visual Analysis
- StockCharts.com
- Technical Analysis of the Financial Markets
- The Visual Investor
- VectorVest, Inc.
- Executive Premier Workshop
- One-Day Options Course
- OptionsPro
- Retirement Income Workshop
- Sure-Fire Trading Systems (VectorVest, Inc.)
- Trading as a Business Workshop
- VectorVest 7 EOD
- VectorVest 7 RealTime/IntraDay
- VectorVest AutoTester
- VectorVest Educational Services
- VectorVest OnLine
- VectorVest Options Analyzer
- VectorVest ProGraphics v6.0
- VectorVest ProTrader 7
- VectorVest RealTime Derby Tool
- VectorVest Simulator
- VectorVest Variator
- VectorVest Watchdog
