HOT TOPICS LIST
- MACD
- Fibonacci
- RSI
- Gann
- ADXR
- Stochastics
- Volume
- Triangles
- Futures
- Cycles
- Volatility
- ZIGZAG
- MESA
- Retracement
- Aroon
INDICATORS LIST
LIST OF TOPICS
PRINT THIS ARTICLE
by Koos van der Merwe
Can a company whose share price has fallen dramatically, be able to revive itself?
Position: Buy
Koos van der Merwe
Has been a technical analyst since 1969, and has worked as a futures and options trader with First Financial Futures in Johannesburg, South Africa.
PRINT THIS ARTICLE
RSI
Taking A Chance
04/29/13 04:21:50 PMby Koos van der Merwe
Can a company whose share price has fallen dramatically, be able to revive itself?
Position: Buy
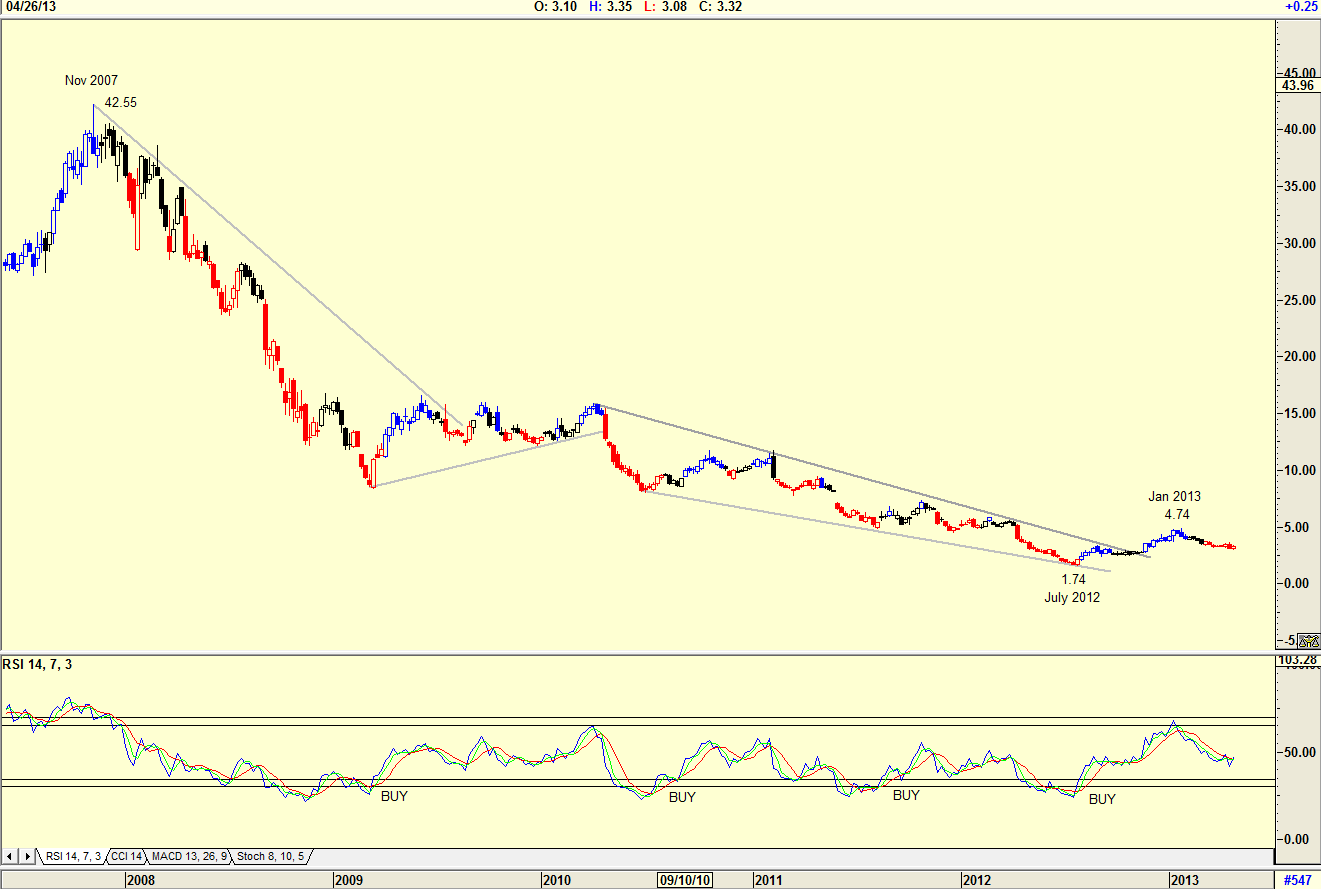
| When a long-term titan faces increased competition, slumping sales, and now-or-never pressure to rejuvenate its stale business model, is there a chance that it will revive? You only have to look at Apple's history and say, "Yes, this could happen, but only if there is another Steve Jobs." The problem is that a Steve Jobs only comes around once, something Tim Cooke is showing us. So, what are the chances of Nokia (NOK) reviving itself? When the company reported earnings last week, the Street was hoping for a reason to believe in the beleaguered stock, but instead shares fell to $3.02 — their lowest levels in five months and a 93% discount to the stock's 2007 high of $42.55. Are traders, who have held their NOK investment through thick and thin, finally realizing that it is time to get rid of their shares? Is the company dying? |

|
| Figure 1: Weekly chart of Nokia. |
| Graphic provided by: AdvancedGET. |
| |
| The weekly chart in Figure 1 shows how the share price fell from the high of $42.55 in November 2007 to a low of $1.74 in July 2012. The share price did recover to $4.74 by January 2013, so those who took the risk and bought at $1.74 are smiling, but fundamentally, was the risk worth the sleepless nights? Technically, the RSI index has shown that all buy signals given on a weekly basis failed. Would you then have bought on an RSI buy in July 2012? I doubt it. What does the daily chart say? |

|
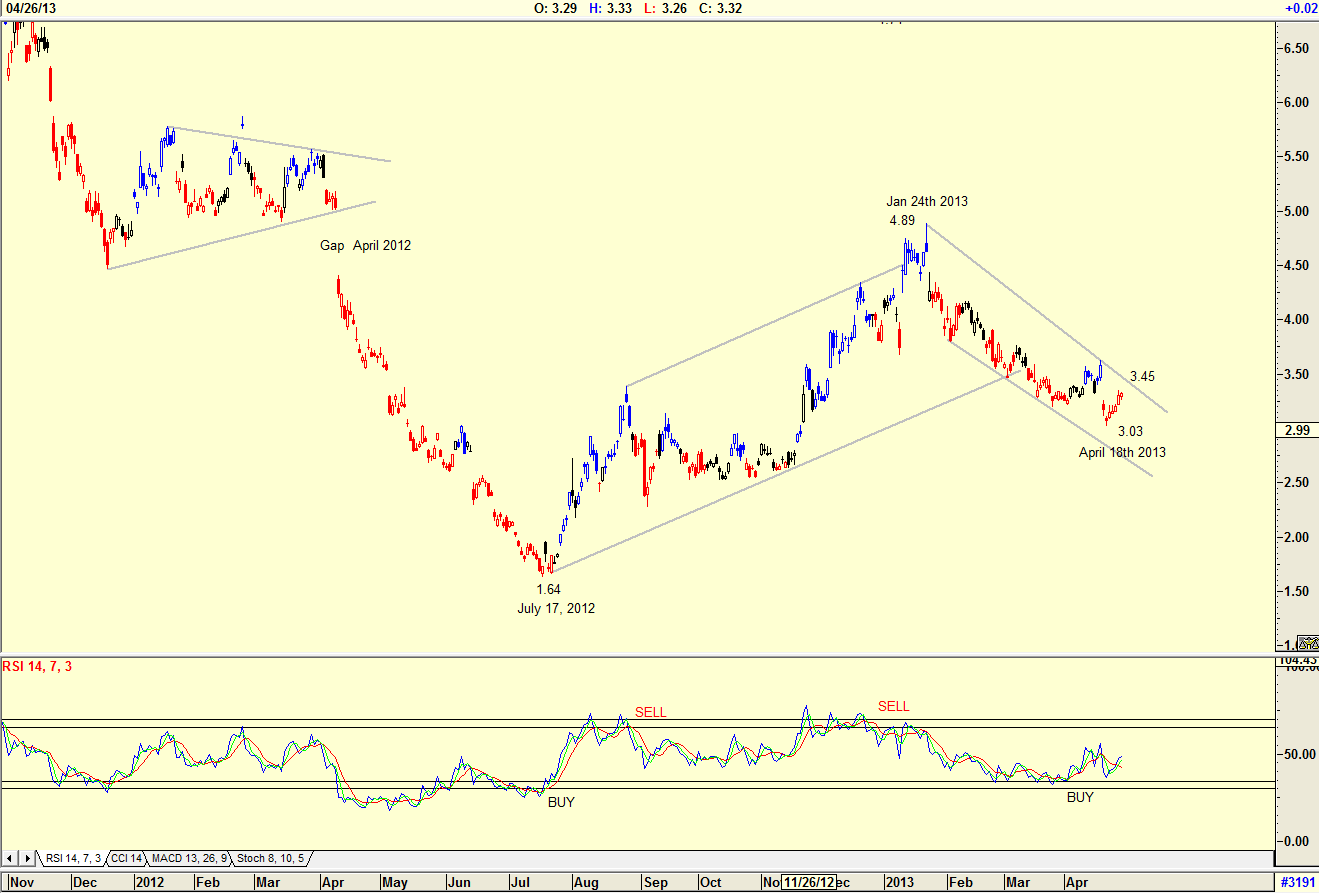
| Figure 2: Daily chart of Nokia. |
| Graphic provided by: AdvancedGET. |
| |
| The daily chart in Figure 2 shows how the price fell on a gap in April 2012, after a flag pattern. This suggests that price will continue to fall. The share price then rose from a low of $1.64 to $4.89 by January 24, 2013 to fill the gap but has since fallen to a low of $3.03 by April 18, 2013. The RSI indicator is suggesting a buy once again, but with a resistance trend line at $3.45, you have to be in doubt. |

|
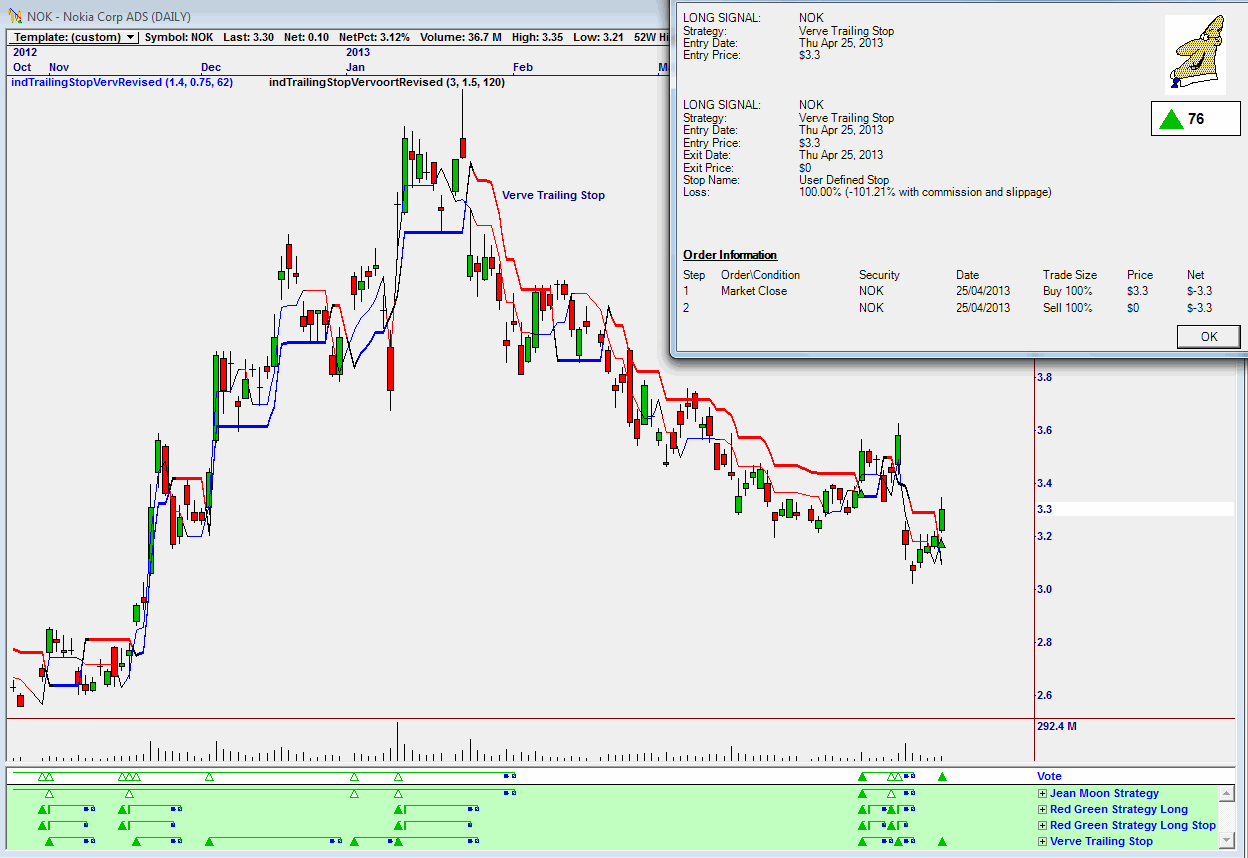
| Figure 3: Omnitrader daily chart showing buy signal on Vote Line. |
| Graphic provided by: Omnitrader.. |
| |
| The chart in Figure 3 is the one that brought NOK to my attention. The chart, in analyzing the share price, gave me a buy signal on the vote line based on the Verve trailing stop strategy. The advisor rating shown is 76, which is high. For a short-term buy, I would consider buying the share for a quick profit. I shall, however, keep my eyes and ears open should there be a management change at any time. I do not believe that NOK is at risk for bankruptcy. The company is forecasting profitability for 2013 and the current cash and equivalents are strong enough to cover current liabilities and future debt payments for some significant time. The company however does not have anything in the pipeline that will help it turn the corner towards renewed profitability. Still, you never know; another Steve Jobs may be out there. |
Has been a technical analyst since 1969, and has worked as a futures and options trader with First Financial Futures in Johannesburg, South Africa.
| Address: | 3256 West 24th Ave |
| Vancouver, BC | |
| Phone # for sales: | 6042634214 |
| E-mail address: | petroosp@gmail.com |
Click here for more information about our publications!
Comments

Request Information From Our Sponsors
- StockCharts.com, Inc.
- Candle Patterns
- Candlestick Charting Explained
- Intermarket Technical Analysis
- John Murphy on Chart Analysis
- John Murphy's Chart Pattern Recognition
- John Murphy's Market Message
- MurphyExplainsMarketAnalysis-Intermarket Analysis
- MurphyExplainsMarketAnalysis-Visual Analysis
- StockCharts.com
- Technical Analysis of the Financial Markets
- The Visual Investor
- VectorVest, Inc.
- Executive Premier Workshop
- One-Day Options Course
- OptionsPro
- Retirement Income Workshop
- Sure-Fire Trading Systems (VectorVest, Inc.)
- Trading as a Business Workshop
- VectorVest 7 EOD
- VectorVest 7 RealTime/IntraDay
- VectorVest AutoTester
- VectorVest Educational Services
- VectorVest OnLine
- VectorVest Options Analyzer
- VectorVest ProGraphics v6.0
- VectorVest ProTrader 7
- VectorVest RealTime Derby Tool
- VectorVest Simulator
- VectorVest Variator
- VectorVest Watchdog
