

HOT TOPICS LIST
- MACD
- Fibonacci
- RSI
- Gann
- ADXR
- Stochastics
- Volume
- Triangles
- Futures
- Cycles
- Volatility
- ZIGZAG
- MESA
- Retracement
- Aroon
INDICATORS LIST
LIST OF TOPICS
PRINT THIS ARTICLE
by Donald W. Pendergast, Jr.
Shares of Dow Chemical (DOW) have surged by nearly 13% in the last eight days, with more near-term gains possible.
Position: N/A
Donald W. Pendergast, Jr.
Freelance financial markets writer and online publisher of the Trendzetterz.com S&P 500 Weekly Forecast service.
PRINT THIS ARTICLE
KELTNER CHANNELS
Dow Chemical: Powerful Rally in Place
04/26/13 04:22:58 PMby Donald W. Pendergast, Jr.
Shares of Dow Chemical (DOW) have surged by nearly 13% in the last eight days, with more near-term gains possible.
Position: N/A
| In between the fast-paced frenzy of day trading and that of longer term, slow-paced position trading lies the fascinating world of swing trading; here's a look at an interesting chart pattern on the 89-minute chart for Dow Chemical. |
|
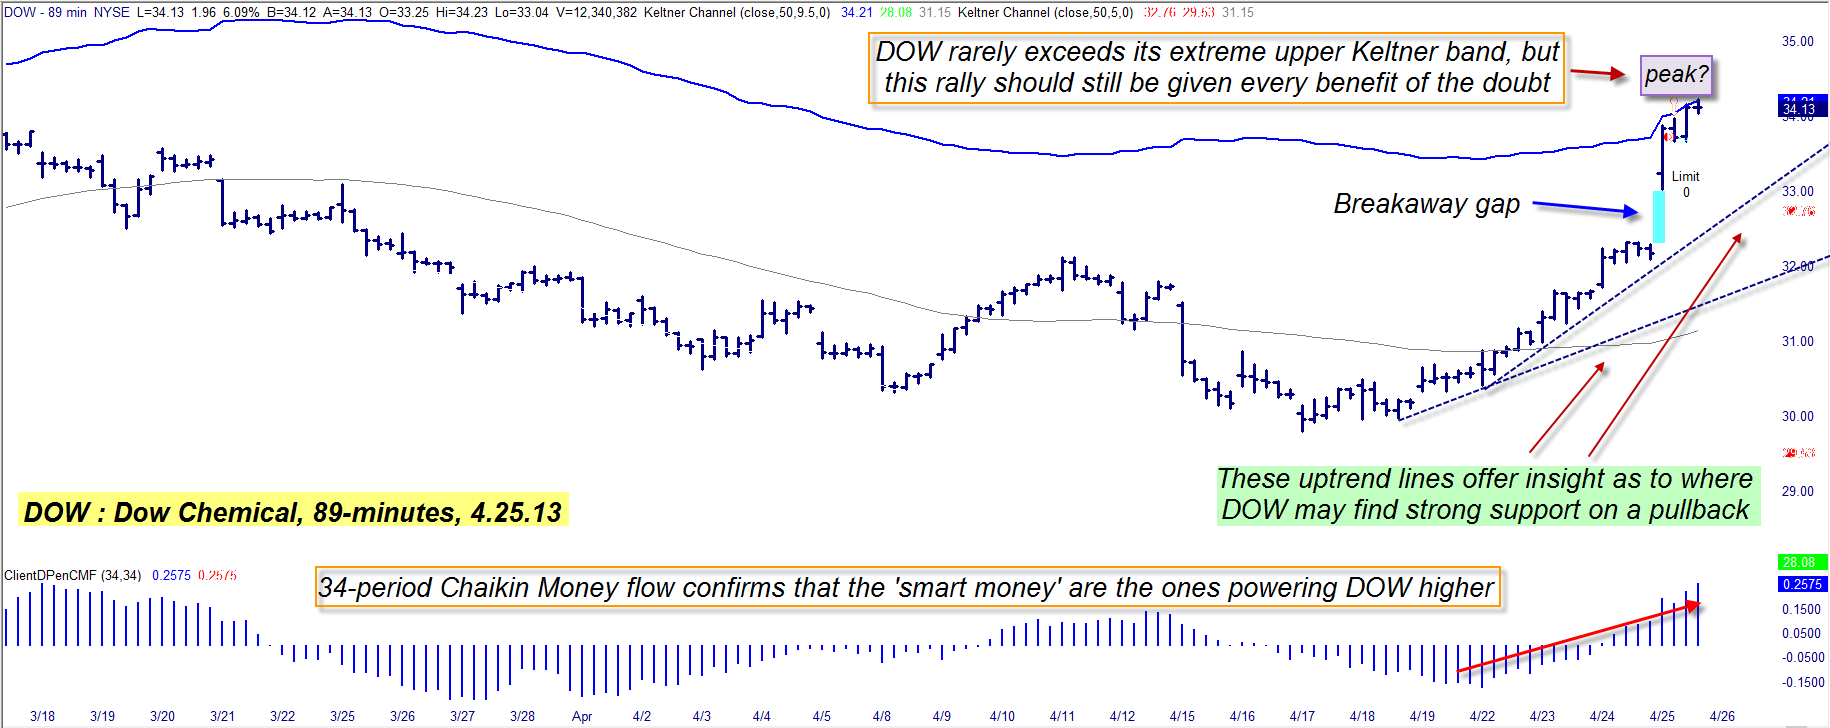
| Figure 1: While DOW's money flow histogram suggests that more upside is possible near-term, this stock rarely spends much time trading above its extreme Keltner band before correcting back to support. |
| Graphic provided by: TradeStation. |
| |
| Traders who enjoy scanning for and then participating in three to eight day market swings tend to use intraday chart time frames ranging from 45 to 120 minutes to help them better time their entries/exits from the repetitive cycle of market swings in their favorite stocks. The use of an 80 to 90 minute chart can be particularly useful for such trading endeavors, particularly for traders who already have a track record of trading success on a daily time frame. Today's chart is an 89-minute Dow Chemical (DOW) version, one overlaid with two sets of Keltner channels set up as follows: 1. The extreme outer bands are set at 9.5 standard deviations away from a 50-period moving average. 2. The inner bands are set at 5 standard deviations away from the same 50-period moving average. Also displayed on the chart is a 34-period Chaikin Money Flow histogram; it tends to work well with the Keltner bands in helping locate low-risk divergence and/or breakout events. In the case of DOW, we find that a nice bullish run began on April 17, 2013, with prices going from 29.81 to 34.23 in only eight days; a bullish breakaway gap occurred a week into the rally, propelling DOW above the third band with tremendous force. Currently, the stock is right up against the extreme upper Keltner band at the same time that its Chaikin Money Flow histogram has made a higher swing high, thus creating a bit of tension for traders, because: 1. DOW rarely spends much time trading at or above its extreme upper band before correcting back to support. 2. The fresh high in the CMF histogram confirms that there is a great deal of money still flowing into DOW — at least on this particular time frame. These are very powerful technical dynamics at work, and sooner or later one of them needs to stand aside and give way to the other — resulting in either more upside for DOW or a modest correction back down to one of its uptrend lines. Instead of trying to "predict" what DOW may do in the next few trading sessions, there is a rational, simple trading setup to use, one based on simple market price action. |
|
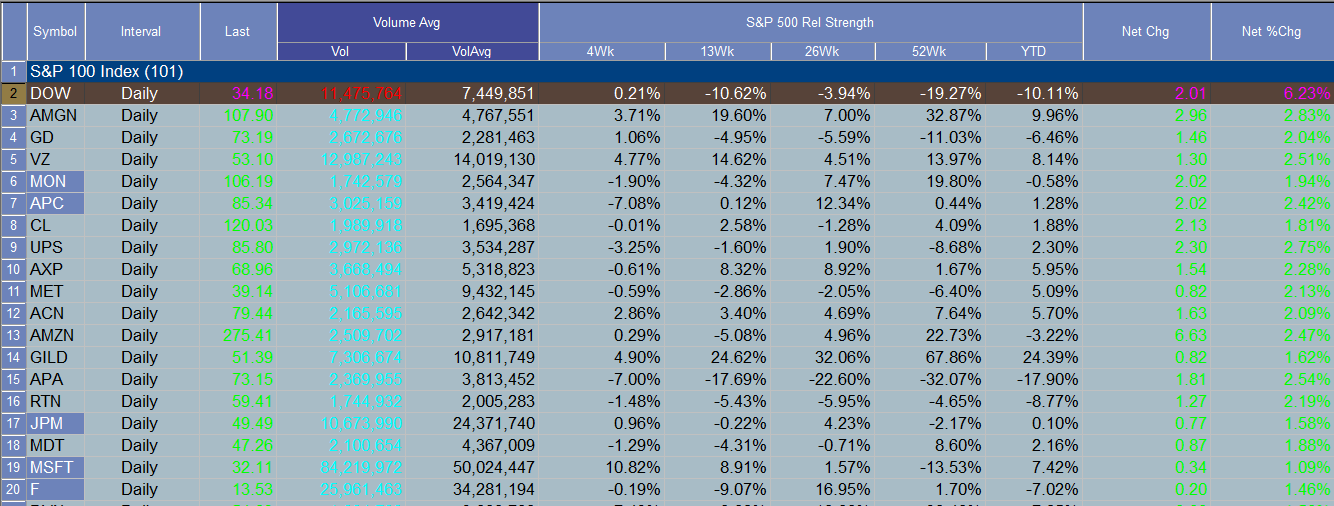
| Figure 2: Shares of Dow Chemical (DOW) lead the S&P 100 index (.OEX) higher during the April 25, 2013 trading session. |
| Graphic provided by: TradeStation. |
| Graphic provided by: TradeStation Radar Screen. |
| |
| Here's the trade setup: 1. Using this same chart, run a two-bar trailing stop of the 89-minute bar lows. 2. If DOW falls four ticks below the low of the preceding two price bars (not counting the current bar) go short, risking no more than .5% to .75% of your account equity. 3. Keeping the same trailing stop logic, look to take half profits (conservative trader may want to take full profits) if the upper trend line is touched (near 33.00). 4. Hold the remaining half of the position until the trailing stop forces you to cover your short. The nice thing about this setup is that you let the stock's price action itself tell you when it wants to start dropping, rather than attempting to "call the top" and placing an ill-timed short trade that could cost you dearly. Trade wisely until we meet here again. |
Freelance financial markets writer and online publisher of the Trendzetterz.com S&P 500 Weekly Forecast service.
| Title: | Market consultant and writer |
| Company: | Trendzetterz |
| Address: | 81 Hickory Hollow Drive |
| Crossville, TN 38555 | |
| Phone # for sales: | 904-303-4814 |
| Website: | trendzetterz.com |
| E-mail address: | support@trendzetterz.com |
Traders' Resource Links | |
| Trendzetterz has not added any product or service information to TRADERS' RESOURCE. | |
Click here for more information about our publications!
Comments

Request Information From Our Sponsors
- StockCharts.com, Inc.
- Candle Patterns
- Candlestick Charting Explained
- Intermarket Technical Analysis
- John Murphy on Chart Analysis
- John Murphy's Chart Pattern Recognition
- John Murphy's Market Message
- MurphyExplainsMarketAnalysis-Intermarket Analysis
- MurphyExplainsMarketAnalysis-Visual Analysis
- StockCharts.com
- Technical Analysis of the Financial Markets
- The Visual Investor
- VectorVest, Inc.
- Executive Premier Workshop
- One-Day Options Course
- OptionsPro
- Retirement Income Workshop
- Sure-Fire Trading Systems (VectorVest, Inc.)
- Trading as a Business Workshop
- VectorVest 7 EOD
- VectorVest 7 RealTime/IntraDay
- VectorVest AutoTester
- VectorVest Educational Services
- VectorVest OnLine
- VectorVest Options Analyzer
- VectorVest ProGraphics v6.0
- VectorVest ProTrader 7
- VectorVest RealTime Derby Tool
- VectorVest Simulator
- VectorVest Variator
- VectorVest Watchdog