

HOT TOPICS LIST
- MACD
- Fibonacci
- RSI
- Gann
- ADXR
- Stochastics
- Volume
- Triangles
- Futures
- Cycles
- Volatility
- ZIGZAG
- MESA
- Retracement
- Aroon
INDICATORS LIST
LIST OF TOPICS
PRINT THIS ARTICLE
by Donald W. Pendergast, Jr.
After enduring a prolonged decline, shares of Harmony Gold Mining (HMY) have now begun to turn higher along with its peers in the ARCA gold bugs index.
Position: N/A
Donald W. Pendergast, Jr.
Freelance financial markets writer and online publisher of the Trendzetterz.com S&P 500 Weekly Forecast service.
PRINT THIS ARTICLE
REVERSAL
HMY: Bullish Turn In Process
04/25/13 02:42:56 PMby Donald W. Pendergast, Jr.
After enduring a prolonged decline, shares of Harmony Gold Mining (HMY) have now begun to turn higher along with its peers in the ARCA gold bugs index.
Position: N/A
| A few days ago, in a TCA article entitled "Gold Stocks Seeking a Multiyear Bottom", I made a case for the possibility that the ARCA gold bugs index (.HUI) was getting close to a major area of support and that a strong rally was going to be the probable outcome, especially if its long term uptrend line was touched. Since the article was written, the .HUI has indeed appeared to have put in a major low, with a strong rally now underway. Here's a look at one of the strongest gold mining stocks as this major bullish turn of events begins to gather strength. |
|
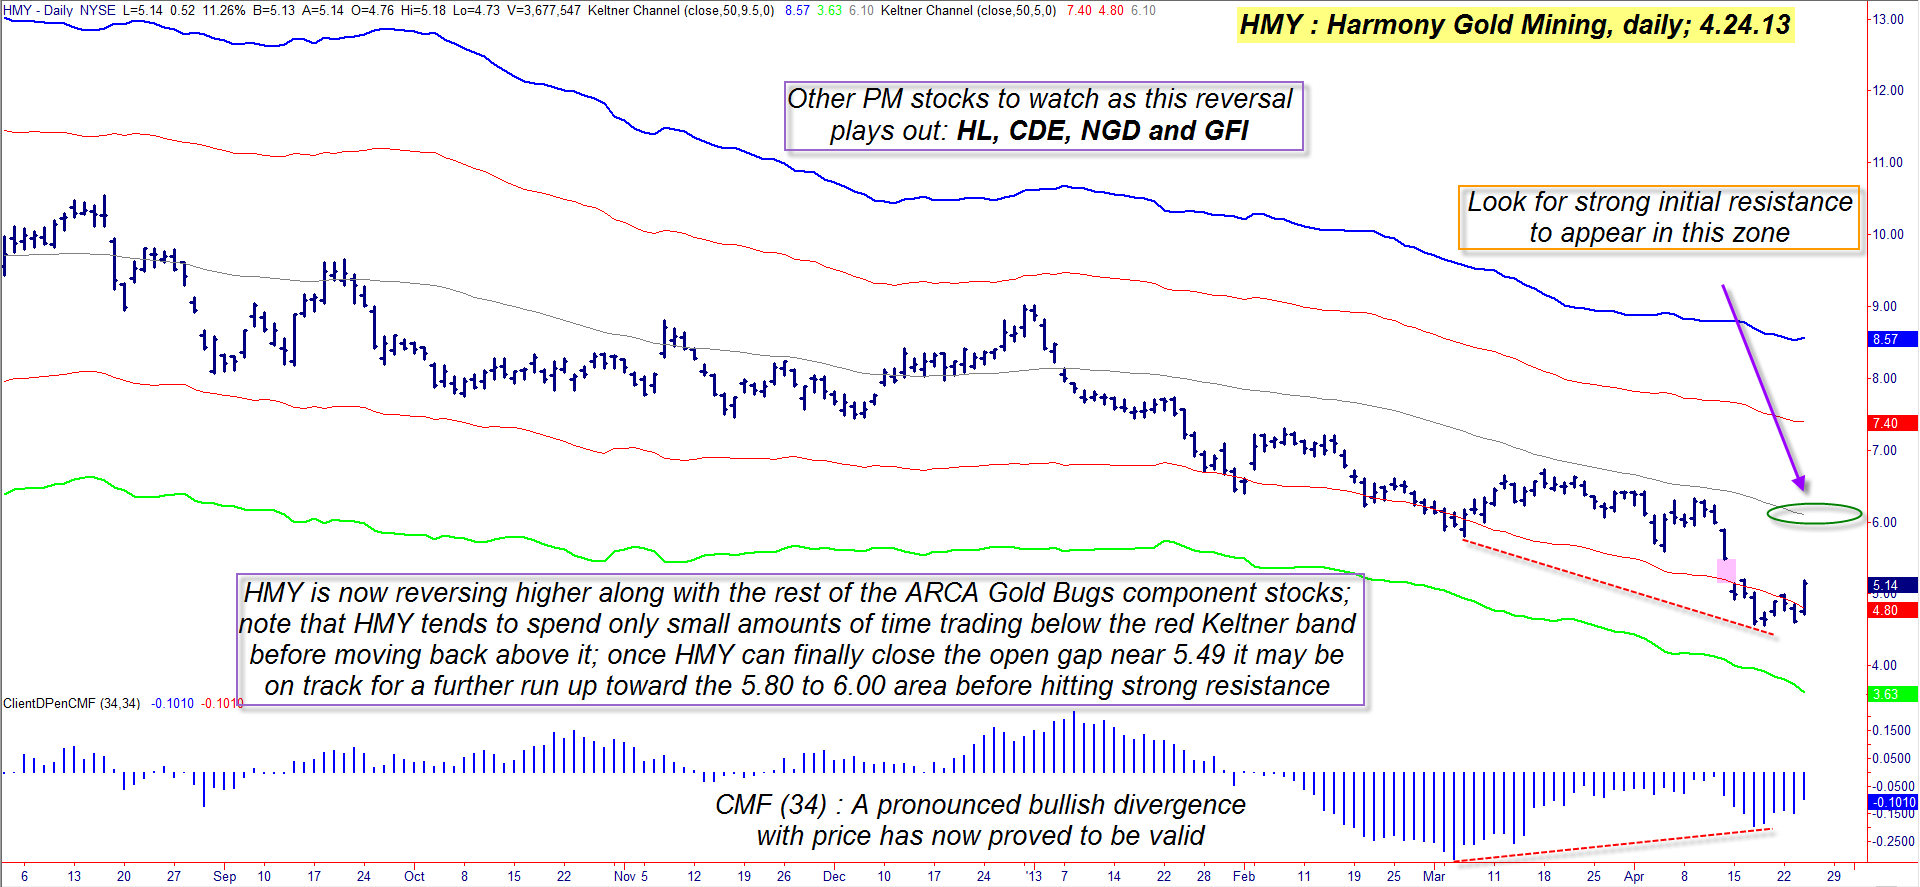
| Figure 1: Several technical factors agree that shares of Harmony Gold Mining (HMY) are in the early stages of a sustained bullish reversal. |
| Graphic provided by: TradeStation. |
| |
| Harmony Gold Mining (HMY) shares had a rough go of it for the first 3 1/2 months of 2013, losing more than 49% between January 2 and April 18, 2013; many other stocks from the gold/silver mining group also suffered large losses in their share prices in the first quarter of 2013. Now, however, the tide appears to have finally turned, with HMY up by nearly 12% intraday during the April 24, 2013, trading session (Figure 1). The most obvious technical clue that had been predicting a bullish reversal was the 34-day Chaikin Money Flow (CMF(34)) histogram -- note how the histogram made a higher low as HMY continued to drop into its major multicycle low on April 18, 2013; this was a powerful confirmation that the "smart money" interests in this stock are confident that a reversal in HMY has a strong potential for meaningful gains in the days and weeks after the final low had been achieved. Less noticeable (but also bullish) is that HMY only spent a brief period of time trading below its red Keltner band (set at 5 standard deviations away from a 50-period exponential moving average) during its 15-week decline and has now reversed sharply higher once again; HMY has only traded below that particular band on six occasions (most lasting only a few bars) since August 2008, and this is yet another confirmation of a powerful reversal. |
|
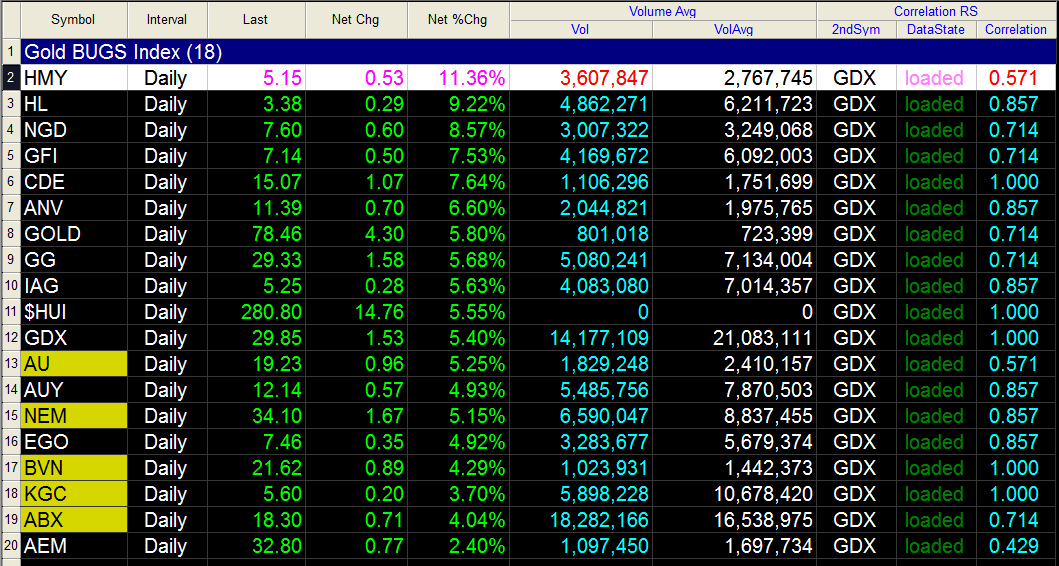
| Figure 2: HMY leads the ARCA Gold Bugs (.HUI) component stock pack higher on April 24, 2013; the stock was actually up by nearly 14% at one point during this trading session. |
| Graphic provided by: TradeStation. |
| Graphic provided by: TradeStation Radar Screen. |
| |
| The bullish surge higher by all .HUI components on April 24, 2013, certainly looks and "feels" like the onset of a sustained rally phase in precious metals (pm) mining stocks, and with HMY leading the pack higher, this is as good a stock as any to focus on in the weeks ahead. While this is ostensibly an excellent 'sell a near term, out-of-the-money put' kind of trade setup, HMY's put option bid ask spreads are too wide to make them a realistic way to attempt to profit from this rally, meaning that swing trading is the way to go. Here's one way to play this reversal: 1. Place a buy stop market order at 5.30 2. If filled, place your initial stop at 4.72 3. Keep your trade risk small, at 1% of your account value 4. If the trade moves in the desired direction, manage the position with a two-bar trailing stop of the daily lows. 5. If HMY rises to between 5.80 and 6.00, consider taking half profits and letting the remaining half run till final stop out. If you have a $10,000 stock account and you want to risk 1% on this trade, the maximum loss you want to incur is $100; since there is a 58-cent difference in the ideal entry price and initial stop price, to keep your trade risk at $100 (before commissions and slippage) you simply divide $100 by the risk factor of .58 to determine how many shares to trade. In this case, 100 divided by .58 = 172 shares of HMY would be allocated for this trade. If you want to risk 2% of your account value, simply divide 200 by .58 and you'll find you can trade 344 shares instead. While this pm stock reversal looks like the real deal this time, be aware that these kinds of stocks can move in wildly unpredictable directions, testing the patience of even the most skilled trader; because of this, be sure to carefully limit your per trade risk to a sensible amount. Trade wisely until we meet here again. |
Freelance financial markets writer and online publisher of the Trendzetterz.com S&P 500 Weekly Forecast service.
| Title: | Market consultant and writer |
| Company: | Trendzetterz |
| Address: | 81 Hickory Hollow Drive |
| Crossville, TN 38555 | |
| Phone # for sales: | 904-303-4814 |
| Website: | trendzetterz.com |
| E-mail address: | support@trendzetterz.com |
Traders' Resource Links | |
| Trendzetterz has not added any product or service information to TRADERS' RESOURCE. | |
Click here for more information about our publications!
PRINT THIS ARTICLE

Request Information From Our Sponsors
- VectorVest, Inc.
- Executive Premier Workshop
- One-Day Options Course
- OptionsPro
- Retirement Income Workshop
- Sure-Fire Trading Systems (VectorVest, Inc.)
- Trading as a Business Workshop
- VectorVest 7 EOD
- VectorVest 7 RealTime/IntraDay
- VectorVest AutoTester
- VectorVest Educational Services
- VectorVest OnLine
- VectorVest Options Analyzer
- VectorVest ProGraphics v6.0
- VectorVest ProTrader 7
- VectorVest RealTime Derby Tool
- VectorVest Simulator
- VectorVest Variator
- VectorVest Watchdog
- StockCharts.com, Inc.
- Candle Patterns
- Candlestick Charting Explained
- Intermarket Technical Analysis
- John Murphy on Chart Analysis
- John Murphy's Chart Pattern Recognition
- John Murphy's Market Message
- MurphyExplainsMarketAnalysis-Intermarket Analysis
- MurphyExplainsMarketAnalysis-Visual Analysis
- StockCharts.com
- Technical Analysis of the Financial Markets
- The Visual Investor