

HOT TOPICS LIST
- MACD
- Fibonacci
- RSI
- Gann
- ADXR
- Stochastics
- Volume
- Triangles
- Futures
- Cycles
- Volatility
- ZIGZAG
- MESA
- Retracement
- Aroon
INDICATORS LIST
LIST OF TOPICS
PRINT THIS ARTICLE
by Chaitali Mohile
The technical charts of GE are reflecting two different views. In which direction will the stock move?
Position: N/A
Chaitali Mohile
Active trader in the Indian stock markets since 2003 and a full-time writer. Trading is largely based upon technical analysis.
PRINT THIS ARTICLE
WEDGE FORMATIONS
GE In Critical Patch
04/26/13 04:18:33 PMby Chaitali Mohile
The technical charts of GE are reflecting two different views. In which direction will the stock move?
Position: N/A
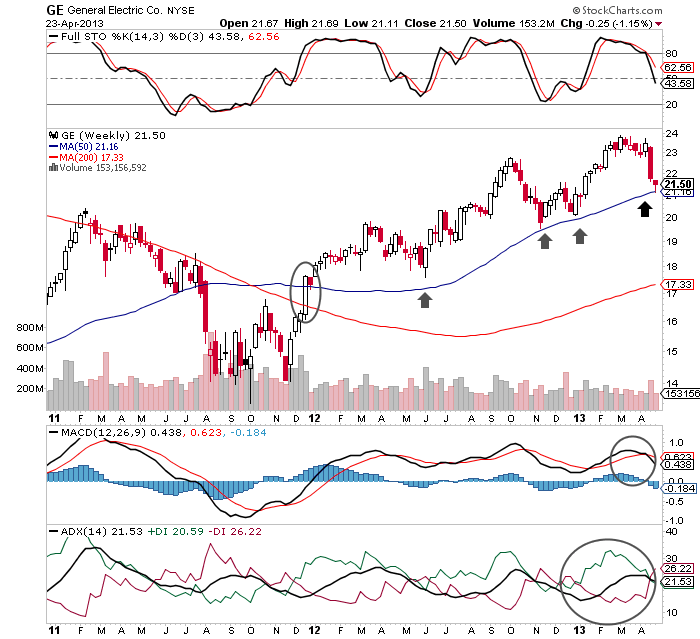
| A bullish moving average (MA) breakout of GE initiated a strong rally. The stock surged with the help of the 50-period moving average (MA) support. This support, however, was frequently challenged but was never breached. The average directional index (ADX(14)) in Figure 1 looks unstable. The higher highs and lows formed by the bullish rally failed to develop a trend for GE. The positive directional index (+DI) and negative directional index (-DI) of the ADX(14) frequently changed direction, resulting in an unstable trend. The bullish trend could hardly sustain above the 25 level. |
| The full stochastic (14,3,3) zigzagged in a wide area between oversold and overbought levels. During the bullish breakout in early 2012, the moving average convergence/divergence (MACD(12,26,9)) surged in positive territory, indicating bullish momentum in the rally. The shaky momentum indicator was one of the reasons for the higher highs and lows of the price rally. |
|
| FIGURE 1: GE, WEEKLY. |
| Graphic provided by: StockCharts.com. |
| |
| GE has once again challenged the 50-period MA support in Figure 1. Currently, the stock is struggling to sustain the MA support. Considering the history, GE is likely to regain its previous high. But the long-term chart (monthly) in Figure 2 gives a different view. |
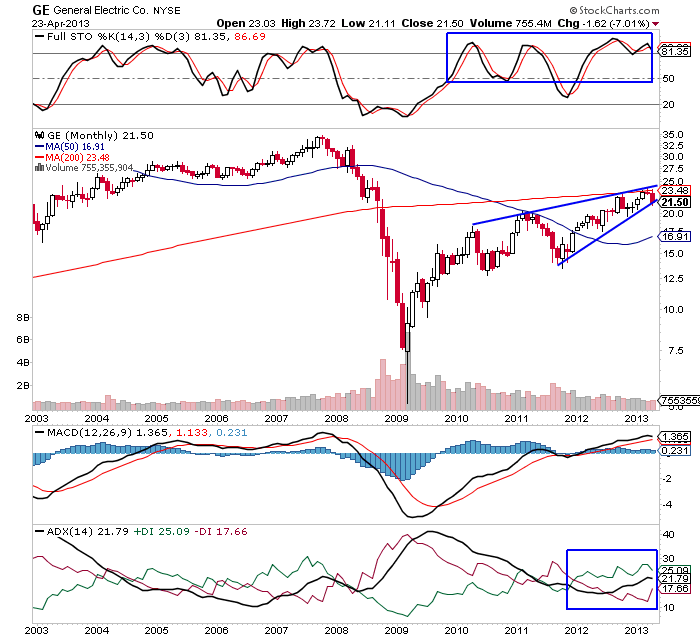
| The pull back rally of GE in Figure 2 has formed a rising wedge — a bearish reversal pattern — below the 200-day MA resistance. The pattern is matured, and therefore, the stock can undergo a bearish breakout at any time. The stochastic oscillator is ready to plunge, and the gap between the MACD line and trigger line is reducing. The ADX(14) is indicating a developing uptrend. Therefore, the jittery indicators are likely to support the anticipated bearish breakout. |
|
| FIGURE 2: GE, MONTHLY. |
| Graphic provided by: StockCharts.com. |
| |
| According to the monthly chart, GE is ready to undergo a bearish breakout. The indicators in Figure 2 are not strongly bullish to violate the 200-period MA resistance and initiate a bullish breakout. Thus, you cannot anticipate an upwards price action on the weekly chart in Figure 1. Although the rally was initiated from the 50-period MA (black arrows in Figure 1), the long-term chart (Figure 2) indicates that bullish movement is likely to be restricted. |
Active trader in the Indian stock markets since 2003 and a full-time writer. Trading is largely based upon technical analysis.
| Company: | Independent |
| Address: | C1/3 Parth Indraprasth Towers. Vastrapur |
| Ahmedabad, Guj 380015 | |
| E-mail address: | chaitalimohile@yahoo.co.in |
Traders' Resource Links | |
| Independent has not added any product or service information to TRADERS' RESOURCE. | |
Click here for more information about our publications!
PRINT THIS ARTICLE

Request Information From Our Sponsors
- StockCharts.com, Inc.
- Candle Patterns
- Candlestick Charting Explained
- Intermarket Technical Analysis
- John Murphy on Chart Analysis
- John Murphy's Chart Pattern Recognition
- John Murphy's Market Message
- MurphyExplainsMarketAnalysis-Intermarket Analysis
- MurphyExplainsMarketAnalysis-Visual Analysis
- StockCharts.com
- Technical Analysis of the Financial Markets
- The Visual Investor
- VectorVest, Inc.
- Executive Premier Workshop
- One-Day Options Course
- OptionsPro
- Retirement Income Workshop
- Sure-Fire Trading Systems (VectorVest, Inc.)
- Trading as a Business Workshop
- VectorVest 7 EOD
- VectorVest 7 RealTime/IntraDay
- VectorVest AutoTester
- VectorVest Educational Services
- VectorVest OnLine
- VectorVest Options Analyzer
- VectorVest ProGraphics v6.0
- VectorVest ProTrader 7
- VectorVest RealTime Derby Tool
- VectorVest Simulator
- VectorVest Variator
- VectorVest Watchdog