

HOT TOPICS LIST
- MACD
- Fibonacci
- RSI
- Gann
- ADXR
- Stochastics
- Volume
- Triangles
- Futures
- Cycles
- Volatility
- ZIGZAG
- MESA
- Retracement
- Aroon
INDICATORS LIST
LIST OF TOPICS
PRINT THIS ARTICLE
by Alan R. Northam
Long-term statistical analysis shows that the Exxon Mobil long-term upward trend could be nearing an end with a long-term reversal downward a possibility.
Position: N/A
Alan R. Northam
Alan Northam lives in the Dallas, Texas area and as an electronic engineer gave him an analytical mind from which he has developed a thorough knowledge of stock market technical analysis. His abilities to analyze the future direction of the stock market has allowed him to successfully trade of his own portfolio over the last 30 years. Mr. Northam is now retired and trading the stock market full time. You can reach him at inquiry@tradersclassroom.com or by visiting his website at http://www.tradersclassroom.com. You can also follow him on Twitter @TradersClassrm.
PRINT THIS ARTICLE
STATISTICS
Exxon Mobil Long Term Trend Reversal?
04/23/13 04:09:44 PMby Alan R. Northam
Long-term statistical analysis shows that the Exxon Mobil long-term upward trend could be nearing an end with a long-term reversal downward a possibility.
Position: N/A
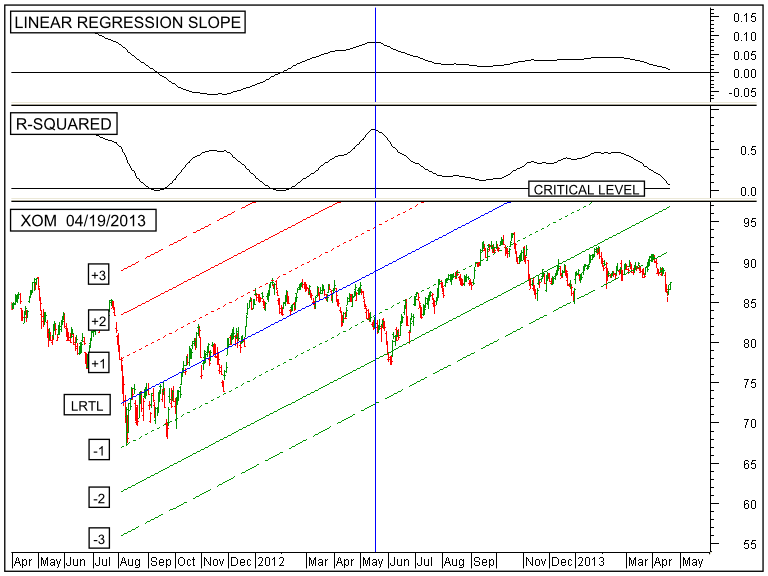
| The lower panel of Figure 1 shows the daily price bars of Exxon Mobil (XOM). This figure also shows the 200-day linear regression trend line (blue upward sloping line) along with the upper 1 sigma channel line (red dotted line), the upper 2 sigma channel line (solid red line), the lower 1 sigma channel (green dotted line), the lower 2 sigma channel line (solid green line), and the lower 3 sigma channel line (dashed green line). The red channel lines represent resistance lines and the green channel lines represent support. |
|
| FIGURE 1: XOM, DAILY. This chart shows the daily price chart of the Exxon Mobil, stock symbol XOM, in the lower panel along with its 200-day linear regression trend line and its associate channel lines. The top panel shows the Linear Regression Slope indicator followed by the R-Squared indicator in the next lower panel. |
| Graphic provided by: MetaStock. |
| |
| The linear regression slope indicator bottomed in November 2011 and rose in a period of price acceleration from November 2011 to May 2012. Following May 2012 the linear regression slope indicator started a long period of moving lower in a period of price deceleration. Price deceleration is typically the last stage of a trend before a reversal in trend sets in. Note that the linear regression slope indicator is still pointing downward and a move below its zero line will indicate a reversal in the long-term trend from up to down. |
| The R-squared moved above its critical level in February 2012 indicating a statistically significant long-term upward trend. By statistically significant, it is meant that there is statistically a 95% confidence level that the upward trend will continue. Notice that the upward trend has continued for more than a year. Also notice that this indicator is pointing downward and is close to moving below its critical level. A move below its critical level will indicate the lack of a statistically significant upward trend, making it vulnerable to a reversal downward. |
| Price has moved below its -3 sigma channel line indicating that a reversal in trend from a long-term upward trend to a long-term downward trend is in progress but not complete. A trend reversal is complete once the linear regression slope indicator moves below its zero line and the R-squared indicator moves below its critical level and then back above its critical level. |
| In conclusion, statistically the long-term upward trend remains in effect as long as the linear regression slope indicator remains above its zero line and the R-squared indicator remains above its critical level. With both of these indicators pointing in a downward direction, and price having moved below its -3 sigma channel line, it looks like a trend reversal from a long-term up trend to a long-term down trend is a possibility. |
Alan Northam lives in the Dallas, Texas area and as an electronic engineer gave him an analytical mind from which he has developed a thorough knowledge of stock market technical analysis. His abilities to analyze the future direction of the stock market has allowed him to successfully trade of his own portfolio over the last 30 years. Mr. Northam is now retired and trading the stock market full time. You can reach him at inquiry@tradersclassroom.com or by visiting his website at http://www.tradersclassroom.com. You can also follow him on Twitter @TradersClassrm.
| Garland, Tx | |
| Website: | www.tradersclassroom.com |
| E-mail address: | inquiry@tradersclassroom.com |
Click here for more information about our publications!
Comments

Request Information From Our Sponsors
- StockCharts.com, Inc.
- Candle Patterns
- Candlestick Charting Explained
- Intermarket Technical Analysis
- John Murphy on Chart Analysis
- John Murphy's Chart Pattern Recognition
- John Murphy's Market Message
- MurphyExplainsMarketAnalysis-Intermarket Analysis
- MurphyExplainsMarketAnalysis-Visual Analysis
- StockCharts.com
- Technical Analysis of the Financial Markets
- The Visual Investor
- VectorVest, Inc.
- Executive Premier Workshop
- One-Day Options Course
- OptionsPro
- Retirement Income Workshop
- Sure-Fire Trading Systems (VectorVest, Inc.)
- Trading as a Business Workshop
- VectorVest 7 EOD
- VectorVest 7 RealTime/IntraDay
- VectorVest AutoTester
- VectorVest Educational Services
- VectorVest OnLine
- VectorVest Options Analyzer
- VectorVest ProGraphics v6.0
- VectorVest ProTrader 7
- VectorVest RealTime Derby Tool
- VectorVest Simulator
- VectorVest Variator
- VectorVest Watchdog