HOT TOPICS LIST
- MACD
- Fibonacci
- RSI
- Gann
- ADXR
- Stochastics
- Volume
- Triangles
- Futures
- Cycles
- Volatility
- ZIGZAG
- MESA
- Retracement
- Aroon
INDICATORS LIST
LIST OF TOPICS
PRINT THIS ARTICLE
by Koos van der Merwe
Receiving a distribution when you hold a share is always welcome, but receiving the distribution and having a capital gain is even more welcome.
Position: Accumulate
Koos van der Merwe
Has been a technical analyst since 1969, and has worked as a futures and options trader with First Financial Futures in Johannesburg, South Africa.
PRINT THIS ARTICLE
MA ENVELOPES
Boston Pizza Royalties Income Fund
04/22/13 04:50:51 PMby Koos van der Merwe
Receiving a distribution when you hold a share is always welcome, but receiving the distribution and having a capital gain is even more welcome.
Position: Accumulate
| Boston Pizza International is a franchise-driven casual dining restaurant company. The company is Canadian owned and operated with restaurants in Canada and the United States. Since inception they have given investors a steady monthly distribution per unit that has slowly increased over the years. In March 2013 they increased the distribution from 0.098 to 0.102 per unit. This has seen the share price climb steadily over the years. |

|
| Figure 1: Daily chart with VOTE line. |
| Graphic provided by: Omnitrader.. |
| |
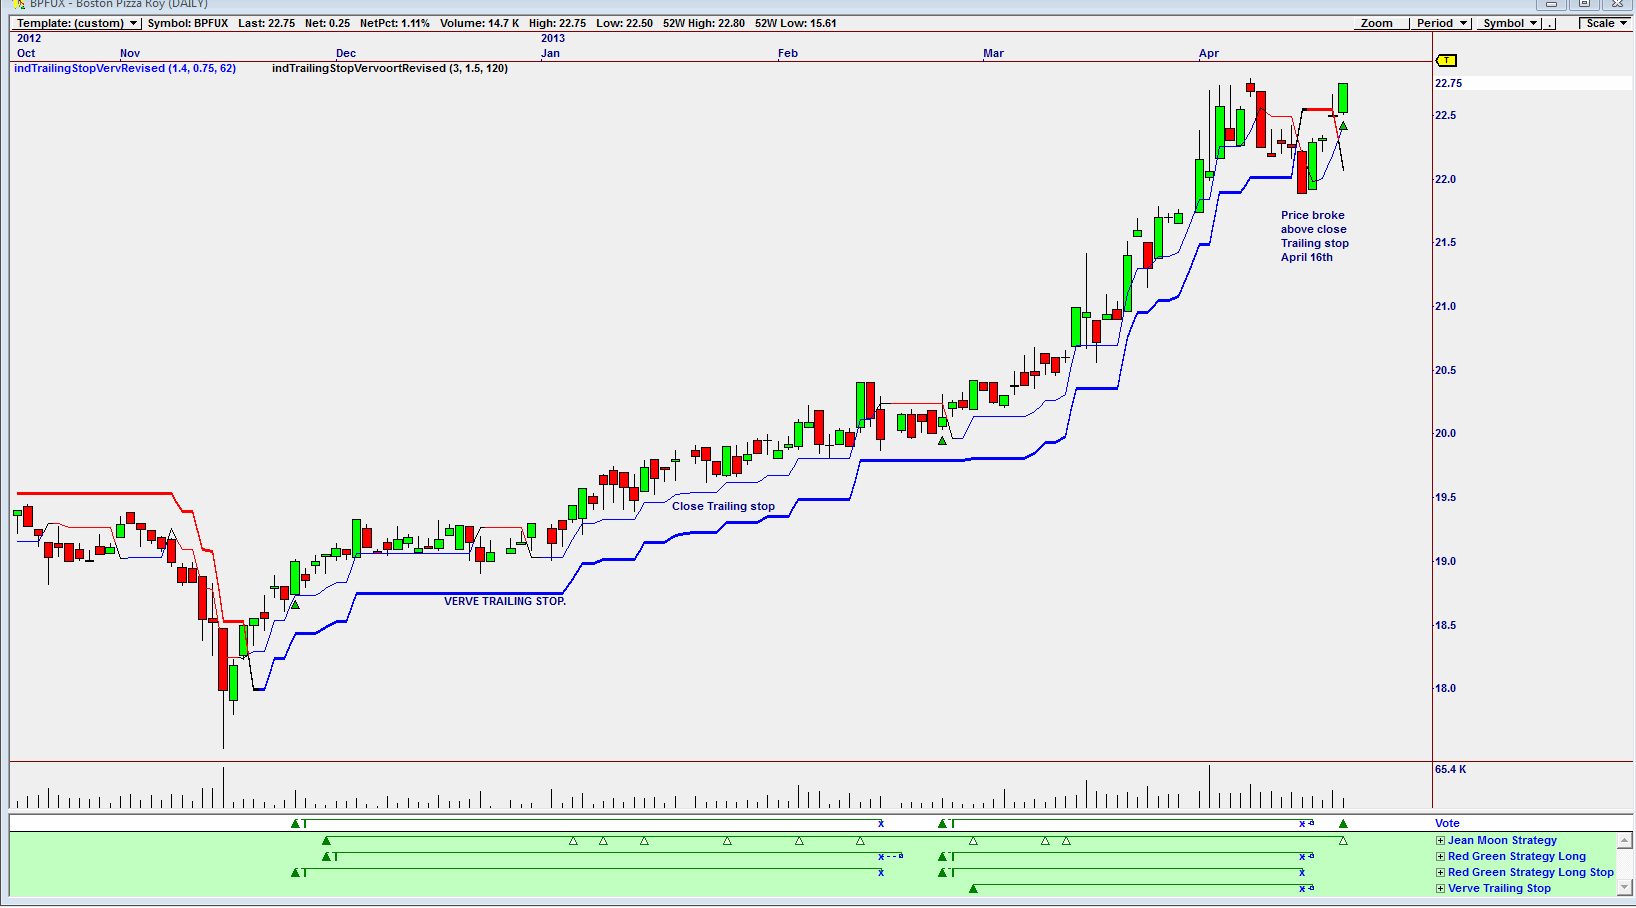
| The chart in Figure 1 is an Omnitrader chart with the vote line showing a new buy signal as the share price rose to $22.75 on April 19, 2013. The vote line gave its signal based on the Jean Moon strategy. This strategy is when the price rises above the upper band of a 15-period moving average offset by 2% positive. Note how on the chart the price also broke above the Verve trailing stop. The price broke above the close trailing stop on April 16, 2013. The close trailing stop is an indicator that warns us of a possible buy or sell. Looking at the chart, you can see how successful the vote line buy signals were. |

|
| Figure 2: Daily chart with JM Internal Band. |
| Graphic provided by: AdvancedGET. |
| |
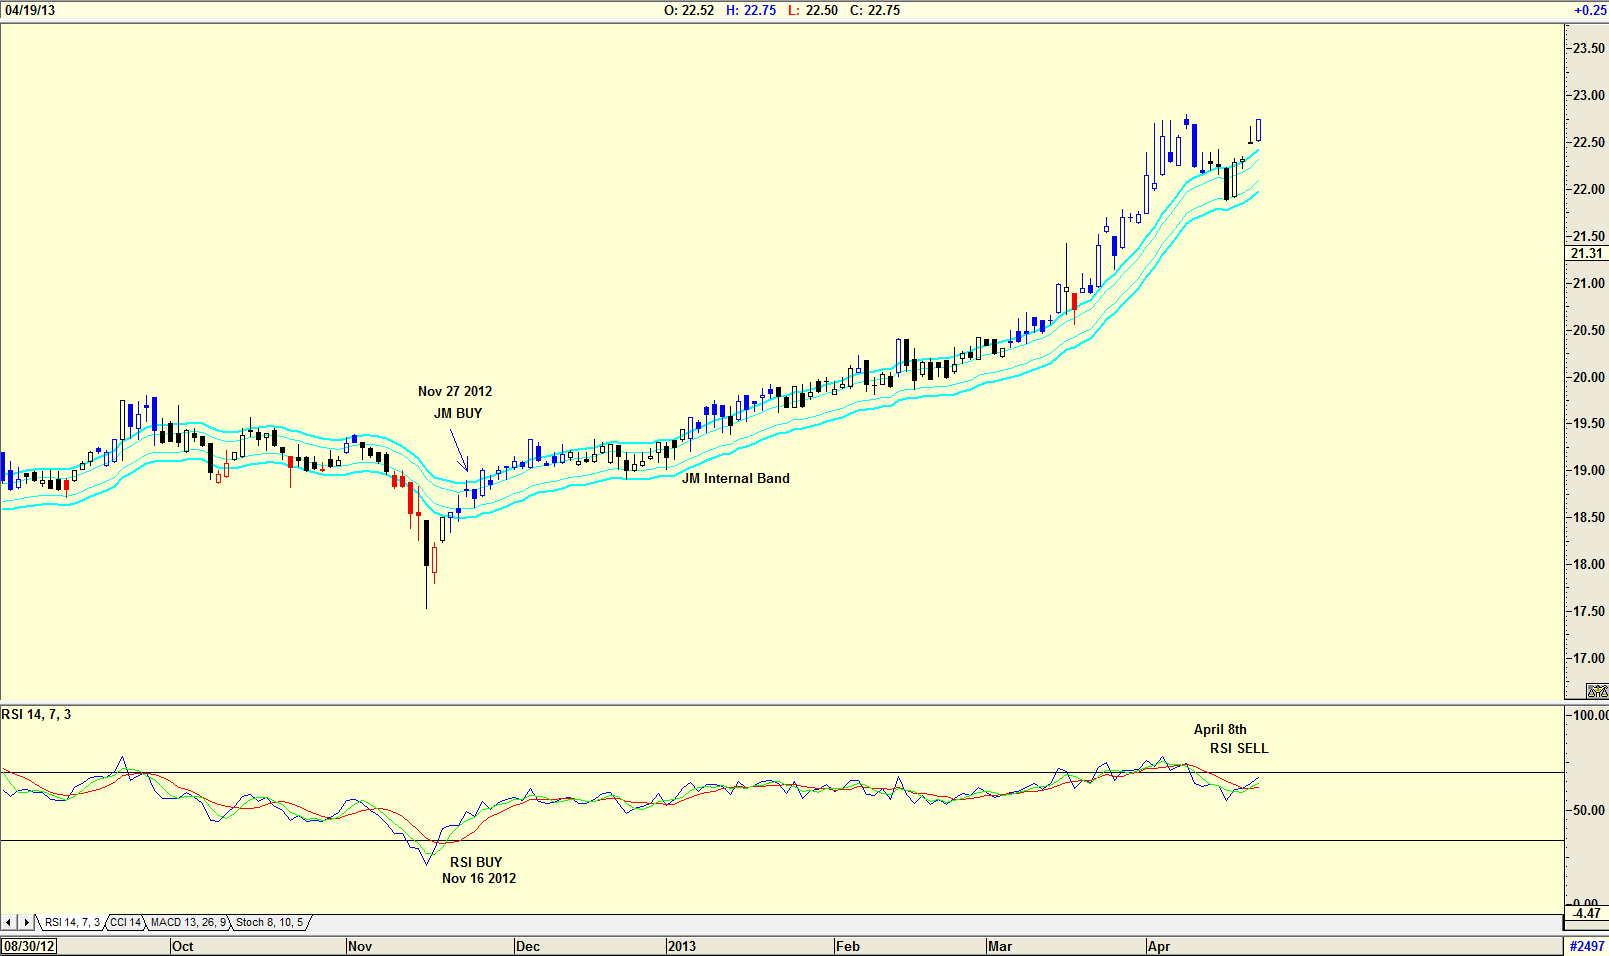
| The chart in Figure 2 is a daily chart showing the JM Internal Band, a 15-period simple moving average offset by 2% positive and 2% negative. Note that a buy signal was given on November 27, 2013. The RSI indicator suggested a buy signal on November 16, 2013 — 12 days earlier. The RSI gave a sell signal on April 8, 2013, that was not confirmed by the JM Internal Band indicator, where the drop in price did not break below the lower JM Internal Band. |

|
| Figure 3: Monthly chart with Elliott Wave Count. |
| Graphic provided by: AdvancedGET. |
| |
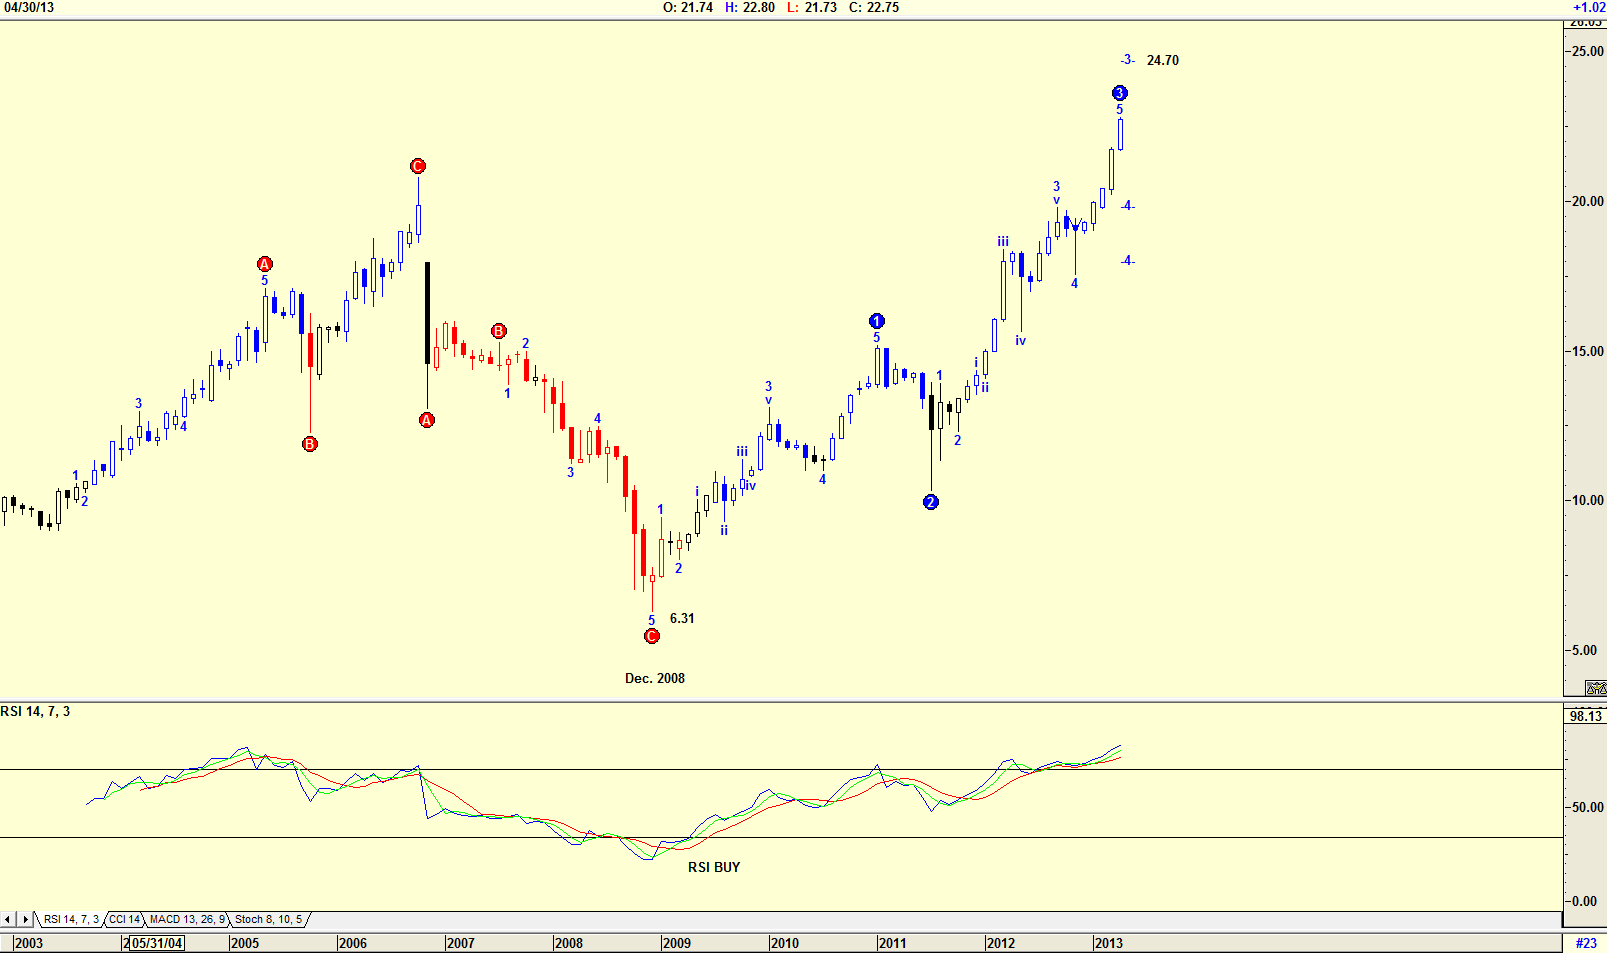
| The chart in Figure 3 is a monthly chart with an Elliott Wave count, suggesting that a WAVE 3 is in process with a possible target of $24.70. The RSI indicator is not giving a sell signal, suggesting that the price could rise to $24.70 before correcting in a WAVE 4. The daily chart in Figure 1 is suggesting a buy for Boston Pizza. The daily chart in Figure 2 is bullish, as is the monthly chart. You can, however, see that a correction could occur in the near future. You should wait for the correction to occur, and buy as the price corrects. A share with a solid steady monthly distribution is always welcome. |
Has been a technical analyst since 1969, and has worked as a futures and options trader with First Financial Futures in Johannesburg, South Africa.
| Address: | 3256 West 24th Ave |
| Vancouver, BC | |
| Phone # for sales: | 6042634214 |
| E-mail address: | petroosp@gmail.com |
Click here for more information about our publications!
PRINT THIS ARTICLE

Request Information From Our Sponsors
- StockCharts.com, Inc.
- Candle Patterns
- Candlestick Charting Explained
- Intermarket Technical Analysis
- John Murphy on Chart Analysis
- John Murphy's Chart Pattern Recognition
- John Murphy's Market Message
- MurphyExplainsMarketAnalysis-Intermarket Analysis
- MurphyExplainsMarketAnalysis-Visual Analysis
- StockCharts.com
- Technical Analysis of the Financial Markets
- The Visual Investor
- VectorVest, Inc.
- Executive Premier Workshop
- One-Day Options Course
- OptionsPro
- Retirement Income Workshop
- Sure-Fire Trading Systems (VectorVest, Inc.)
- Trading as a Business Workshop
- VectorVest 7 EOD
- VectorVest 7 RealTime/IntraDay
- VectorVest AutoTester
- VectorVest Educational Services
- VectorVest OnLine
- VectorVest Options Analyzer
- VectorVest ProGraphics v6.0
- VectorVest ProTrader 7
- VectorVest RealTime Derby Tool
- VectorVest Simulator
- VectorVest Variator
- VectorVest Watchdog
