

HOT TOPICS LIST
- MACD
- Fibonacci
- RSI
- Gann
- ADXR
- Stochastics
- Volume
- Triangles
- Futures
- Cycles
- Volatility
- ZIGZAG
- MESA
- Retracement
- Aroon
INDICATORS LIST
LIST OF TOPICS
PRINT THIS ARTICLE
by Donald W. Pendergast, Jr.
The ARCA gold bugs index is in the midst of its largest selloff since 2008, but it may soon meet with a formidable support level.
Position: N/A
Donald W. Pendergast, Jr.
Freelance financial markets writer and online publisher of the Trendzetterz.com S&P 500 Weekly Forecast service.
PRINT THIS ARTICLE
REL. STR OSCILL
Gold Stocks Seeking A Multiyear Bottom
04/22/13 04:47:10 PMby Donald W. Pendergast, Jr.
The ARCA gold bugs index is in the midst of its largest selloff since 2008, but it may soon meet with a formidable support level.
Position: N/A
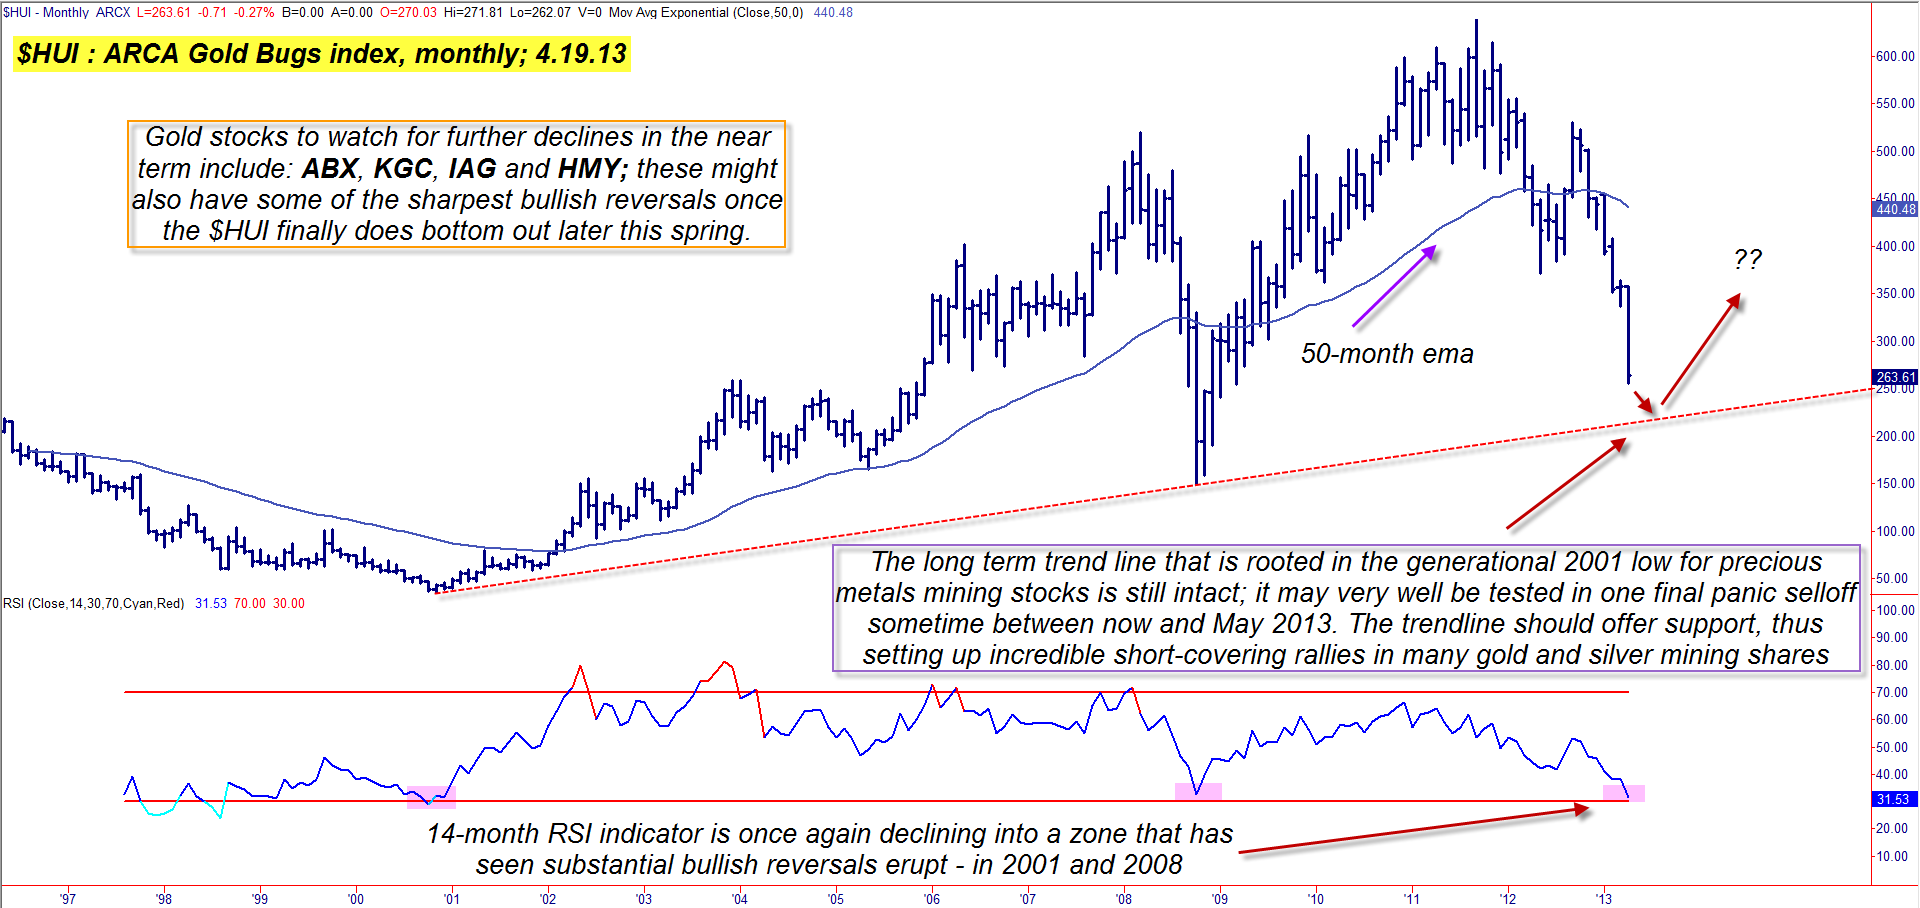
| The ARCA gold bugs index (.HUI) has been falling like the proverbial stone since peaking out in September 2011 and is down nearly 60% in the past 19 months; while the last couple of years have seen plenty of wild price action in the precious metals markets, there may soon be highly volatile price action if the .HUI's long-term uptrend line manages to act as solid support for the badly beaten index. Let's take a closer look. |
|
| Figure 1: With the 14-month RSI indicator now at a level even lower than it was in late 2008, the probabilities for a bullish reversal grow more likely with each passing day; the long term uptrend line needs to hold for such a rally to be seen in the next few weeks and/or months. |
| Graphic provided by: TradeStation. |
| |
| Compared to the price moves typically seen in the broad US stock indexes, the extended, long-term rallies and declines in the .HUI are supercharged, with waves of diehard mining stock bulls and bears driving its component stocks on massive tears — in either direction. While no one really knows if the long-term bull market in gold and silver (beginning circa 2001) and their related mining shares is finally over, it's fairly certain that the bulls in these stocks will soon have another shot at the long side. Looking at the monthly chart in Figure 1 of the .HUI, we find two important clues that are alerting traders that a significant reversal may be seen in the next few weeks (months?), as witnessed by the: 1. The 14-month RSI indicator has fallen all the way to the 31.53 level, an area that served notice that a long-term bottom was finally in place — see the pink boxes on the RSI window — and the current RSI reading is less than it was in October 2008. 2. The long-term uptrend line lies just beneath the current reading of 263.61 and should serve as a powerful support barrier, should it be tested soon. Bear in mind that even though these are extremely "big picture" views of the .HUI and aren't meant to offer any kind of pinpoint market timing advice, they can still help traders and investors get prepared for what may be a monumental short-covering rally in the world of gold and silver mining stocks. Long-term trend lines, for example, particularly if they haven't been tested too many times before, will frequently provide enough support to allow traders to get in on a powerful relief rally, one typically caused by short covering. The trend line is about ten points below the current reading of the .HUI, and if you see a sudden spike lower down toward the 245.00 to 250.00 level followed by an equally sharp spike higher, that may be the tip-off that the .HUI has finally bottomed and is ready to regain at least a portion of its massive losses since the fall of 2011. And even without another scare selloff, many of the stocks in the .HUI are already manifesting double bottom patterns on their respective 30-, 60- and 90-minute time frames; most traders should simply watch the daily bar chart of the .HUI, however, looking to see a close above 273.95 before going long again. One way to play an .HUI reversal is to sell near-term out-of-the-money puts on some of the large cap stocks in the index; Barrick Gold (ABX) and Goldcorp (GG) both look like excellent candidates for such a trading plan, but again, only if the .HUI closes back above 273.95. |
|
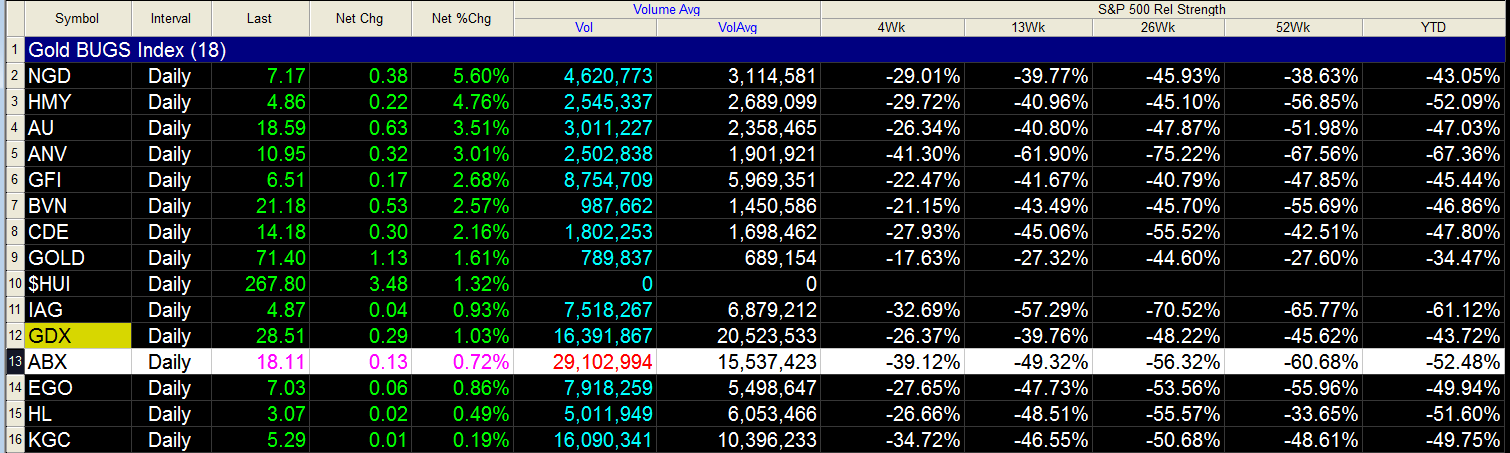
| Figure 2: The component stocks of the ARCA Gold Bugs index (.HUI) stage a sharp rally on April 19, 2013. |
| Graphic provided by: TradeStation. |
| Graphic provided by: TradeStation Radar Screen. |
| |
| The June '13 ABX $17.00 put option looks interesting for such a reversal; open interest comes in at 3,761 contracts and the bid/ask spread is a mere penny. The put has a theta (time decay) factor of $1 per day/per contract and its strike price is more than $1.00 below the stock's current price of 18.11. This put's premium has been greatly inflated due to the speed and severity of its recent decline, and any decent rally should cause it to lose value quickly - which is just what a put seller wants to see happen. If you go this route and short a put in ABX, be sure to risk no more than 1% of your account value on the trade; also make certain you buy the put back if it loses 50 to 60% of its value if the stock rallies. Conversely, if ABX stumbles and continues to decline, by no means let the stock go in-the-money (below 17.00) or permit the put to rise in value by 85-90% before buying it back. Trade wisely until we meet here again. |
Freelance financial markets writer and online publisher of the Trendzetterz.com S&P 500 Weekly Forecast service.
| Title: | Market consultant and writer |
| Company: | Trendzetterz |
| Address: | 81 Hickory Hollow Drive |
| Crossville, TN 38555 | |
| Phone # for sales: | 904-303-4814 |
| Website: | trendzetterz.com |
| E-mail address: | support@trendzetterz.com |
Traders' Resource Links | |
| Trendzetterz has not added any product or service information to TRADERS' RESOURCE. | |
Click here for more information about our publications!
Comments

Request Information From Our Sponsors
- StockCharts.com, Inc.
- Candle Patterns
- Candlestick Charting Explained
- Intermarket Technical Analysis
- John Murphy on Chart Analysis
- John Murphy's Chart Pattern Recognition
- John Murphy's Market Message
- MurphyExplainsMarketAnalysis-Intermarket Analysis
- MurphyExplainsMarketAnalysis-Visual Analysis
- StockCharts.com
- Technical Analysis of the Financial Markets
- The Visual Investor
- VectorVest, Inc.
- Executive Premier Workshop
- One-Day Options Course
- OptionsPro
- Retirement Income Workshop
- Sure-Fire Trading Systems (VectorVest, Inc.)
- Trading as a Business Workshop
- VectorVest 7 EOD
- VectorVest 7 RealTime/IntraDay
- VectorVest AutoTester
- VectorVest Educational Services
- VectorVest OnLine
- VectorVest Options Analyzer
- VectorVest ProGraphics v6.0
- VectorVest ProTrader 7
- VectorVest RealTime Derby Tool
- VectorVest Simulator
- VectorVest Variator
- VectorVest Watchdog