

HOT TOPICS LIST
- MACD
- Fibonacci
- RSI
- Gann
- ADXR
- Stochastics
- Volume
- Triangles
- Futures
- Cycles
- Volatility
- ZIGZAG
- MESA
- Retracement
- Aroon
INDICATORS LIST
LIST OF TOPICS
PRINT THIS ARTICLE
by Chaitali Mohile
Ligand Pharmaceuticals is heading towards major resistance. Will it continue its bullish journey?
Position: Hold
Chaitali Mohile
Active trader in the Indian stock markets since 2003 and a full-time writer. Trading is largely based upon technical analysis.
PRINT THIS ARTICLE
ROUND TOP & BOTTOM
LGND On Bullish Path?
04/19/13 02:19:26 PMby Chaitali Mohile
Ligand Pharmaceuticals is heading towards major resistance. Will it continue its bullish journey?
Position: Hold
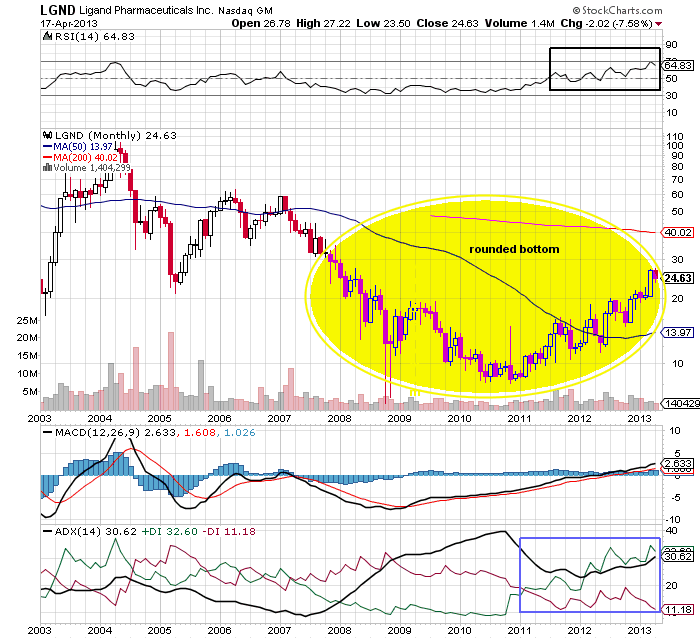
| In 2004 Ligand Pharmaceutical (LGND) began a robust bearish rally (Figure 1). Due to weak bullish support, LGND could not sustain at its all-time high near $100 levels. You can see from the monthly chart in Figure 1, that none of the indicators showed any bullish force. The downside rally gradually breached the 50-day moving average (MA) support, challenging a previous low pivot at $20 levels. Thereafter, LGND remained under bearish pressure staying below the resistance of the MA. It moved sideways in between the 50-day MA resistance and the low pivot. After consolidation, the stock resumed its previous downside journey. |
| However, LGND established support at a new low just below $10 in 2010-2011. A bearish trend that was formed by the downwards rally had turned highly overheated. The relative strength index (RSI(14)) was oversold for almost three years, and the moving average convergence/divergence (MACD (12,26,9)) was extremely negative (-10). These extreme conditions suggested a trend reversal rally. Eventually, LGND surged from lower levels, generating fresh bullish sentiments. |
|
| FIGURE 1: LGND, MONTHLY. |
| Graphic provided by: StockCharts.com. |
| |
| As the stock began moving upwards, a rounded bottom formation was visible in Figure 1. This pattern is a bullish formation that breaks in an upwards direction. The breakout is confirmed once the 50-day MA resistance is converted to support. This confirmed breakout triggers good buying opportunities for traders as well as investors. The average directional index (ADX(14)) in Figure 1 developed a fresh uptrend for LGND. The RSI(14) surged in the bullish region above 50 levels, and the MACD(12,26,9) steadily moved upwards in positive territory. These indicators reflected upcoming bullish strength; as a result, the stock established strong support at the 50-day MA. Thus, the bullish breakout of the rounded bottom was confirmed. |
| LGND is now approaching its psychological resistance zone between $30 and $40. Various highs and lows formed during the fall, and has generated robust resistance in this area. Therefore, the bullish rally of LGND is likely to turn volatile above $30. The 200-day MA would also be a strong technical resistance for the rally. The stock would require robust bullish strength to survive in this area. The positive MACD(12,26,9) and the developing uptrend are moving parallel with the bullish rally. But the RSI(14) can play a spoilsport, as the indicator is reluctant to climb above the $70 levels. Therefore, traders should secure half of their profits near 40 levels and stay watchful. Till then the traders with long positions can enjoy the bullish ride. Although the stock has a long way to go, we should capture the small trade with low risk. |
| Looks like LGND is likely to continue its bullish journey to $40 (and the resistance established by the 200-day MA). |
Active trader in the Indian stock markets since 2003 and a full-time writer. Trading is largely based upon technical analysis.
| Company: | Independent |
| Address: | C1/3 Parth Indraprasth Towers. Vastrapur |
| Ahmedabad, Guj 380015 | |
| E-mail address: | chaitalimohile@yahoo.co.in |
Traders' Resource Links | |
| Independent has not added any product or service information to TRADERS' RESOURCE. | |
Click here for more information about our publications!
PRINT THIS ARTICLE

Request Information From Our Sponsors
- StockCharts.com, Inc.
- Candle Patterns
- Candlestick Charting Explained
- Intermarket Technical Analysis
- John Murphy on Chart Analysis
- John Murphy's Chart Pattern Recognition
- John Murphy's Market Message
- MurphyExplainsMarketAnalysis-Intermarket Analysis
- MurphyExplainsMarketAnalysis-Visual Analysis
- StockCharts.com
- Technical Analysis of the Financial Markets
- The Visual Investor
- VectorVest, Inc.
- Executive Premier Workshop
- One-Day Options Course
- OptionsPro
- Retirement Income Workshop
- Sure-Fire Trading Systems (VectorVest, Inc.)
- Trading as a Business Workshop
- VectorVest 7 EOD
- VectorVest 7 RealTime/IntraDay
- VectorVest AutoTester
- VectorVest Educational Services
- VectorVest OnLine
- VectorVest Options Analyzer
- VectorVest ProGraphics v6.0
- VectorVest ProTrader 7
- VectorVest RealTime Derby Tool
- VectorVest Simulator
- VectorVest Variator
- VectorVest Watchdog