HOT TOPICS LIST
- MACD
- Fibonacci
- RSI
- Gann
- ADXR
- Stochastics
- Volume
- Triangles
- Futures
- Cycles
- Volatility
- ZIGZAG
- MESA
- Retracement
- Aroon
INDICATORS LIST
LIST OF TOPICS
PRINT THIS ARTICLE
by Gary Grosschadl
This biopharmaceutical development company is showing several interesting formations on its daily and weekly chart.
Position: N/A
Gary Grosschadl
Independent Canadian equities trader and technical analyst based in Peterborough
Ontario, Canada.
PRINT THIS ARTICLE
CHART ANALYSIS
XOMA Ltd. - A Biotech Play On The Move
08/19/02 09:34:53 AMby Gary Grosschadl
This biopharmaceutical development company is showing several interesting formations on its daily and weekly chart.
Position: N/A
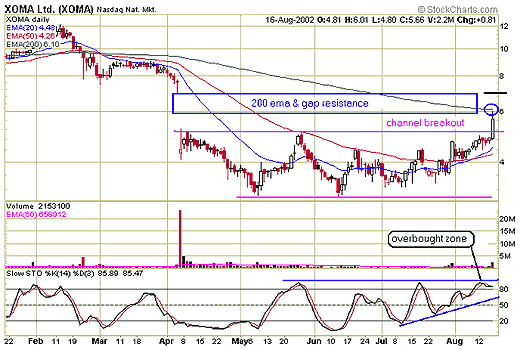
 The daily chart of XOMA Ltd. (XOMA) shows the stock has broken out of its basing channel pattern with a dramatic one day move, but is it sustainable? The stock balked just short of 200-day EMA resistance. Note the bullish moving average crossover when the 20-day EMA crossed above the 50-day EMA. That was a very timely signal for those traders watching closely. |
| After such an advance it would make sense to see the stock go through some consolidation or retracement if it doesn't immediately move past the $6.10 barrier, to perhaps spike up to the top of the gap at around $7. Note too, that stochastics are in the overbought zone. |

|
| Graphic provided by: stockcharts.com. |
| |
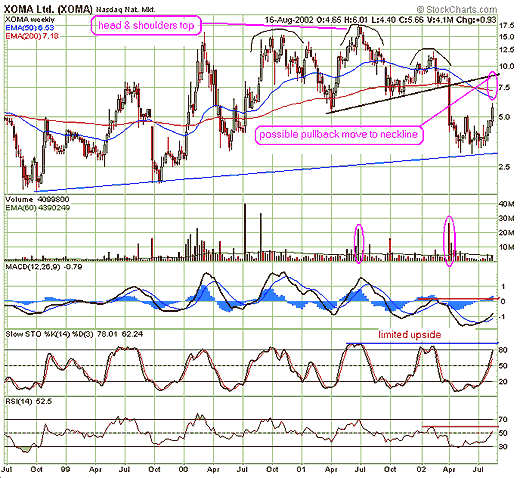
| What does the weekly chart show and suggest? This longer-term three year chart shows a topping head and shoulders formation and the current pullback test. Note the dramatic drop through the neckline. Traders who failed to exit quickly on the daily chart were caught in a gap down move. |
| The weekly chart suggests a bit more short-term upside than the daily chart with the former's target area encompassing three upside levels: 50-day EMA at 6.63, 200-day EMA at $7.18, and the actual neckline around $9. However the stock advance was seemingly halted by mid-candle resistance from the previous large drop. This represents the middle of the gap resistance on the daily chart. |
| So as with the daily chart, the trader is faced with a similar scenario - some additional upside is possible if the stock immediately goes higher in the next trading day or two. If the stock gives up ground instead, look for some consolidation or retracement. Should a bold move occur up to, or close to, that trendline and then fail, traders should be alert for the pullback move failure to set up a shorting opportunity. Traders should then ensure that a "weight of evidence" is in their favor to mitigate the risk -- several indications that the stock is indeed weak. This could take the form of a bearish candle formation, short-term stochastics turning down from overbought levels, and failure at a specific resistance point such as the 200-day EMA or actual neckline. |
Independent Canadian equities trader and technical analyst based in Peterborough
Ontario, Canada.
| Website: | www.whatsonsale.ca/financial.html |
| E-mail address: | gwg7@sympatico.ca |
Click here for more information about our publications!
Comments
Date: 08/20/02Rank: 5Comment: Gary,
Could you please e-mail me the web site(s)that you use for chart studies?
Thanks.
Sincerely,
Boris (mal_boris@hotmail.com)

Request Information From Our Sponsors
- StockCharts.com, Inc.
- Candle Patterns
- Candlestick Charting Explained
- Intermarket Technical Analysis
- John Murphy on Chart Analysis
- John Murphy's Chart Pattern Recognition
- John Murphy's Market Message
- MurphyExplainsMarketAnalysis-Intermarket Analysis
- MurphyExplainsMarketAnalysis-Visual Analysis
- StockCharts.com
- Technical Analysis of the Financial Markets
- The Visual Investor
- VectorVest, Inc.
- Executive Premier Workshop
- One-Day Options Course
- OptionsPro
- Retirement Income Workshop
- Sure-Fire Trading Systems (VectorVest, Inc.)
- Trading as a Business Workshop
- VectorVest 7 EOD
- VectorVest 7 RealTime/IntraDay
- VectorVest AutoTester
- VectorVest Educational Services
- VectorVest OnLine
- VectorVest Options Analyzer
- VectorVest ProGraphics v6.0
- VectorVest ProTrader 7
- VectorVest RealTime Derby Tool
- VectorVest Simulator
- VectorVest Variator
- VectorVest Watchdog
