

HOT TOPICS LIST
- MACD
- Fibonacci
- RSI
- Gann
- ADXR
- Stochastics
- Volume
- Triangles
- Futures
- Cycles
- Volatility
- ZIGZAG
- MESA
- Retracement
- Aroon
INDICATORS LIST
LIST OF TOPICS
PRINT THIS ARTICLE
by Chaitali Mohile
The Energy Select Sector ETF is struggling to sustain near previous high resistance.
Position: N/A
Chaitali Mohile
Active trader in the Indian stock markets since 2003 and a full-time writer. Trading is largely based upon technical analysis.
PRINT THIS ARTICLE
CHART ANALYSIS
XLE Near Previous High
04/16/13 03:52:19 PMby Chaitali Mohile
The Energy Select Sector ETF is struggling to sustain near previous high resistance.
Position: N/A
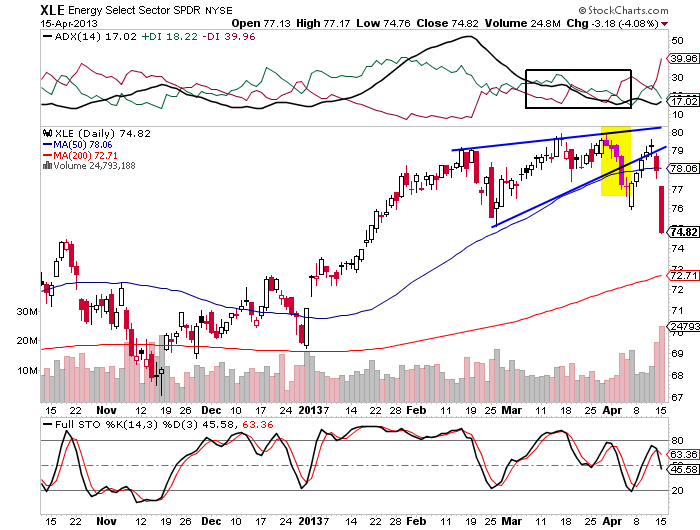
| A conical trading range of Energy Select Sector (XLE) has breached the 50-day moving average (MA) support on its daily time frame chart in Figure 1. The tapering range appears like a short-term bullish flag & pennant formation. After a bullish breakout of the short-term MA in January 2013, the newly formed support was challenged due to a highly overheated uptrend in February. XLE retraced towards the 50-day MA support and surged, regaining its strength. The average directional index (ADX) in Figure 1, however, plunged from an overheated region (above 40) and failed to recover. The trend indicator failed to climb above the 20 levels. This suggested weakening trend of XLE. |
| The index eventually slipped below the MA support. Currently, the full stochastic (14,3,3) has turned oversold, which can initiate an intermediate pullback session. In the past, the oscillator moved upwards from the oversold region, gaining lost levels. In addition, a doji candlestick is followed by a bullish candlestick, which is likely to form a morning star candlestick pattern in Figure 1 (see the yellow block). Therefore, XLE is likely to move back into its conical trading range. Since the ADX (14) is weak, the index consolidation may turn volatile. |
|
| FIGURE 1: XLE, DAILY. |
| Graphic provided by: StockCharts.com. |
| |
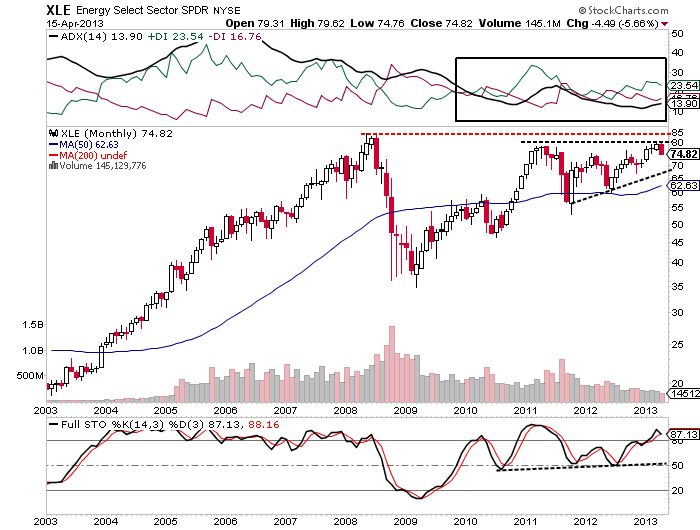
| According to the monthly chart in Figure 2, XLE has almost reached its previous high resistance at $85. A pull back rally that began in 2009 has recovered all the losses it made in previous corrections. XLE has been consolidating under the prior high resistance. The bullish rally has formed the bullish flag & pennant near its resistance line. Although the bullish continuation pattern breaks in an upward direction, the two indicators; ADX (14) and the stochastic oscillator are not ready to undergo an upward breakout. |
|
| FIGURE 2: XLE, MONTHLY. |
| Graphic provided by: StockCharts.com. |
| |
| The ADX (14) in Figure 2 is below the 15 level with tangled positive (+DI) and negative directional index (-DI). The momentum indicator is highly overbought at 91 levels, suggesting a trend reversal rally. It means that XLE can either plunge or move sideways in the future as well. Since the index is already consolidating, this range-bound action would continue for the next few sessions as well. During this long-term consolidation phase, XLE could retrace a few points from its current level. |
| XLE has to gather additional bullish strength to breach robust resistance at $85. Till then the index would consolidate at bullish levels. |
Active trader in the Indian stock markets since 2003 and a full-time writer. Trading is largely based upon technical analysis.
| Company: | Independent |
| Address: | C1/3 Parth Indraprasth Towers. Vastrapur |
| Ahmedabad, Guj 380015 | |
| E-mail address: | chaitalimohile@yahoo.co.in |
Traders' Resource Links | |
| Independent has not added any product or service information to TRADERS' RESOURCE. | |
Click here for more information about our publications!
Comments

Request Information From Our Sponsors
- StockCharts.com, Inc.
- Candle Patterns
- Candlestick Charting Explained
- Intermarket Technical Analysis
- John Murphy on Chart Analysis
- John Murphy's Chart Pattern Recognition
- John Murphy's Market Message
- MurphyExplainsMarketAnalysis-Intermarket Analysis
- MurphyExplainsMarketAnalysis-Visual Analysis
- StockCharts.com
- Technical Analysis of the Financial Markets
- The Visual Investor
- VectorVest, Inc.
- Executive Premier Workshop
- One-Day Options Course
- OptionsPro
- Retirement Income Workshop
- Sure-Fire Trading Systems (VectorVest, Inc.)
- Trading as a Business Workshop
- VectorVest 7 EOD
- VectorVest 7 RealTime/IntraDay
- VectorVest AutoTester
- VectorVest Educational Services
- VectorVest OnLine
- VectorVest Options Analyzer
- VectorVest ProGraphics v6.0
- VectorVest ProTrader 7
- VectorVest RealTime Derby Tool
- VectorVest Simulator
- VectorVest Variator
- VectorVest Watchdog