

HOT TOPICS LIST
- MACD
- Fibonacci
- RSI
- Gann
- ADXR
- Stochastics
- Volume
- Triangles
- Futures
- Cycles
- Volatility
- ZIGZAG
- MESA
- Retracement
- Aroon
INDICATORS LIST
LIST OF TOPICS
PRINT THIS ARTICLE
by Donald W. Pendergast, Jr.
Shares of Freeport McMoran Copper and Gold are selling off hard, gapping below a key support level.
Position: N/A
Donald W. Pendergast, Jr.
Freelance financial markets writer and online publisher of the Trendzetterz.com S&P 500 Weekly Forecast service.
PRINT THIS ARTICLE
GAPS
FCX Gaps Below Support
04/17/13 03:50:03 PMby Donald W. Pendergast, Jr.
Shares of Freeport McMoran Copper and Gold are selling off hard, gapping below a key support level.
Position: N/A
| The stocks of companies involved in gold, silver, and copper mining are generally a volatile bunch, full of surprises and frequent fakeout/shakeout moves as they seek to determine their respective near-term and long-term trend directions. With the giant intraday sell-off in key gold/silver mining stocks (and in the physical gold and silver markets, too) taking the Gold Bugs index down by nearly 8% on April 15, 2013, traders are left wondering if this is "the" final, washout low prior to a substantial rebound rally or if the stocks from this group are destined to get hammered even further. Here's a look now at a giant miner's stock, one that has one foot each in the gold mining and copper mining camps. |
|
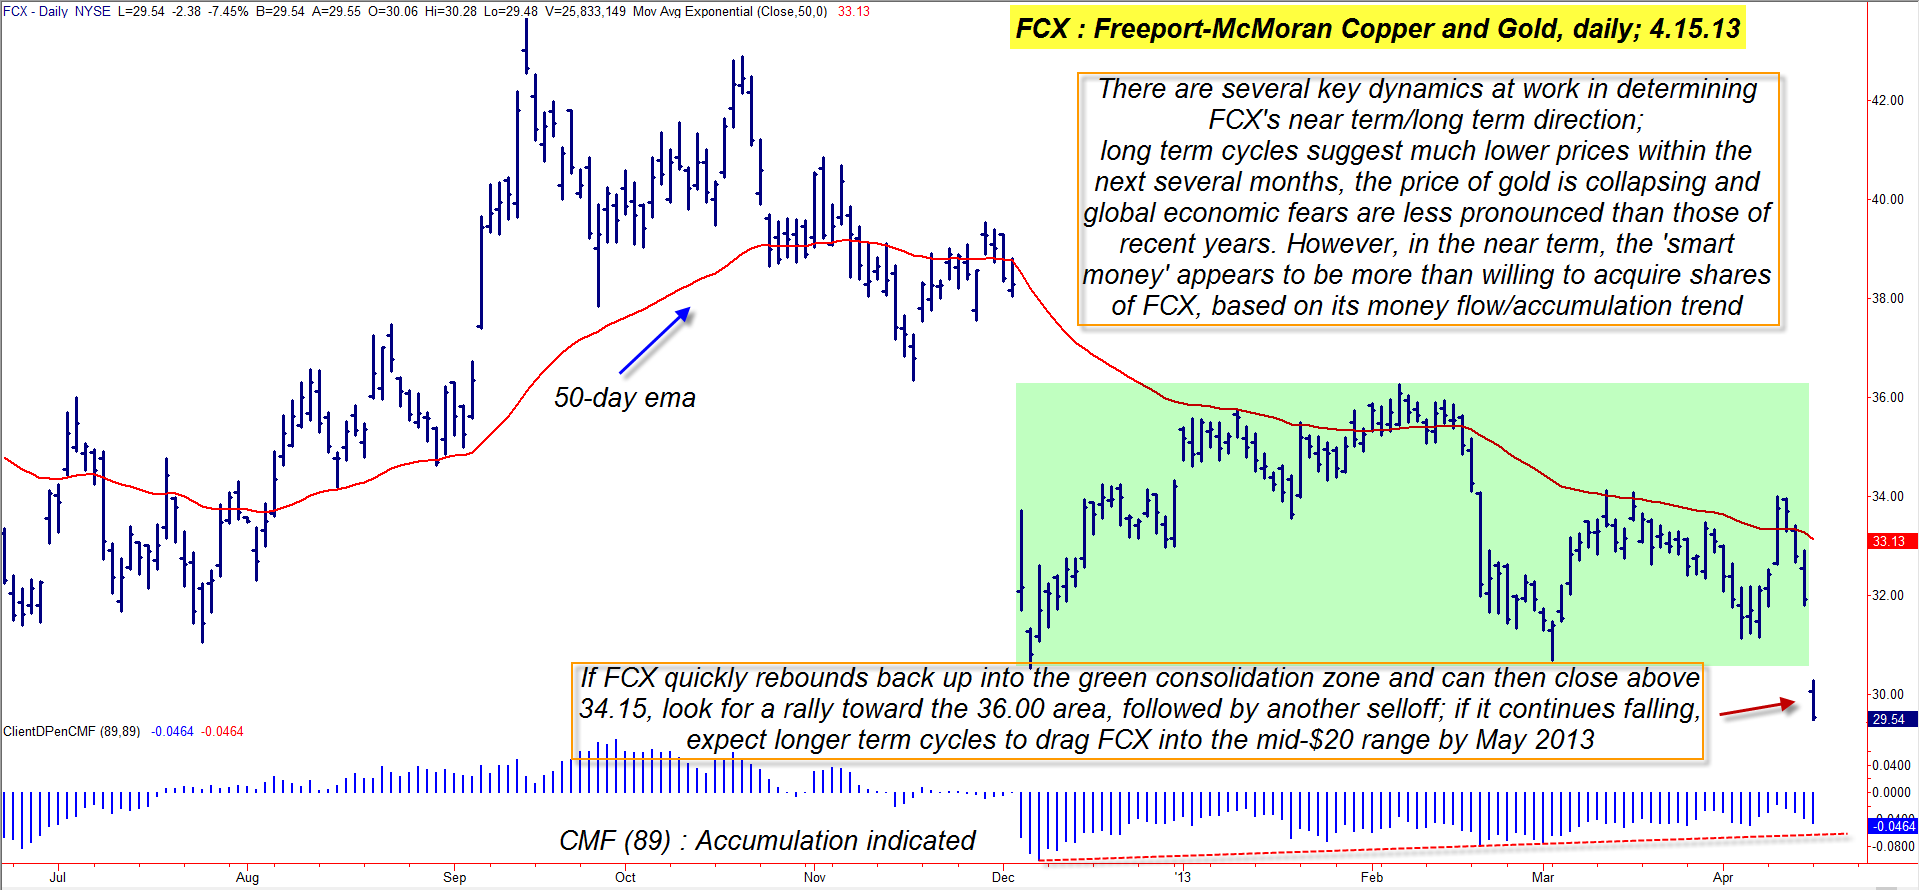
| Figure 1: With FCX gapping down below its key 30.00 support level, traders need to watch the stock to see if this is a 'bear trap' prior to a rally or if it's a sign that high-degree, bearish price cycles are intent on moving FCX down to much lower prices through the spring of 2013. |
| Graphic provided by: TradeStation. |
| |
| Freeport McMoran Copper and Gold (FCX) spends a lot of time in choppy consolidations and short-term trends, more than some of its smaller cap mining brethren, but it can and does break out into large trending moves once or twice a year, on average. The stock has spent the last 4 1/2 months in a large trading range pattern (green shaded box in Figure 1) but has now gapped lower out of the pattern, taking out a key support level near 30.00; with the price of gold and silver also off by about 7%, it's not hard to understand why traders and investors (not to mention institutions) are selling out of FCX and other gold mining shares, looking to deploy capital into safer havens. But a closer look at FCX's daily chart in Figure 1 reveals that the so-called "smart money" interests in the market had actually been accumulating FCX since it made a major multicycle low in early December 2012. The 89-day Chaikin Money flow histogram (CMF(89)) at the bottom of the chart depicts this accumulation very well, and it will be fascinating to see if this latest gap lower by FCX is simply a major fakeout/bear trap prior to a substantial rally, or not. Traders need to watch for either of these following two scenarios to unfold in FCX: 1. The stock quickly reverses from its April 15, 2013 lows and manages a daily close back in the green consolidation zone, followed soon after by a rise above its last swing high of 34.00. If this happens, the bulls will be back in firm control of FCX — for the time being. 2. If FCX continues to plummet, it means that the long term cycles in the stock — several of which are not scheduled to bottom until late May/early June 2013 — are now the dominant forces driving FCX to substantially lower prices. In such a case, any rallies will be short-lived and dangerous to trade until after these high degree cycles finally bottom out. |
|
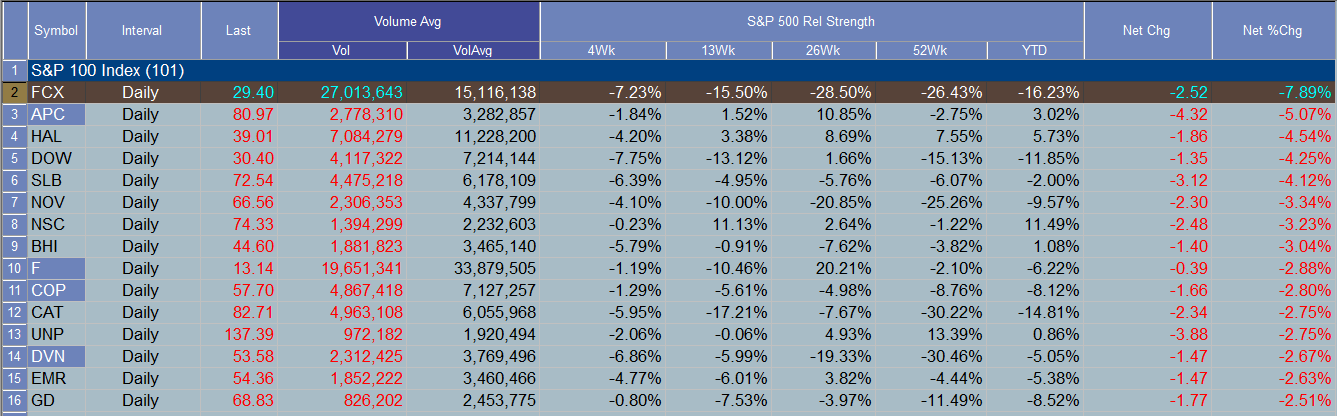
| Figure 2: Of all the S&P 100 index (.OEX) stocks, FCX is the one being hammered the worst as of April 15, 2013. |
| Graphic provided by: TradeStation. |
| Graphic provided by: TradeStation Radar Screen. |
| |
| Playing FCX here might be a bit tricky, but here are a couple of ideas you may wish to consider: 1. On a daily close above 34.00, consider selling a May '13 FCX $30.00 put option; the bid/ask spread is excellent and the open interest figure is nearly 25,000 contracts. Manage the trade by taking profits if the option declines in value by 50% or buy it back for a loss if it rises in value by 80-90%. 2. Short sellers of the stock might want to watch to see if FCX can rally back up into the green zone and then start to sell off hard again. On a drop below 29.00, consider shorting the stock, running a two-bar trailing stop of the daily highs until final stop out. If the long term cycles apply lots of pressure to FCX, there is a good chance of a profit on such a short setup. Risk only 1% of your account value if shorting the stock and remember to trade wisely until we meet here again. |
Freelance financial markets writer and online publisher of the Trendzetterz.com S&P 500 Weekly Forecast service.
| Title: | Market consultant and writer |
| Company: | Trendzetterz |
| Address: | 81 Hickory Hollow Drive |
| Crossville, TN 38555 | |
| Phone # for sales: | 904-303-4814 |
| Website: | trendzetterz.com |
| E-mail address: | support@trendzetterz.com |
Traders' Resource Links | |
| Trendzetterz has not added any product or service information to TRADERS' RESOURCE. | |
Click here for more information about our publications!
Comments

Request Information From Our Sponsors
- VectorVest, Inc.
- Executive Premier Workshop
- One-Day Options Course
- OptionsPro
- Retirement Income Workshop
- Sure-Fire Trading Systems (VectorVest, Inc.)
- Trading as a Business Workshop
- VectorVest 7 EOD
- VectorVest 7 RealTime/IntraDay
- VectorVest AutoTester
- VectorVest Educational Services
- VectorVest OnLine
- VectorVest Options Analyzer
- VectorVest ProGraphics v6.0
- VectorVest ProTrader 7
- VectorVest RealTime Derby Tool
- VectorVest Simulator
- VectorVest Variator
- VectorVest Watchdog
- StockCharts.com, Inc.
- Candle Patterns
- Candlestick Charting Explained
- Intermarket Technical Analysis
- John Murphy on Chart Analysis
- John Murphy's Chart Pattern Recognition
- John Murphy's Market Message
- MurphyExplainsMarketAnalysis-Intermarket Analysis
- MurphyExplainsMarketAnalysis-Visual Analysis
- StockCharts.com
- Technical Analysis of the Financial Markets
- The Visual Investor