

HOT TOPICS LIST
- MACD
- Fibonacci
- RSI
- Gann
- ADXR
- Stochastics
- Volume
- Triangles
- Futures
- Cycles
- Volatility
- ZIGZAG
- MESA
- Retracement
- Aroon
INDICATORS LIST
LIST OF TOPICS
PRINT THIS ARTICLE
by Alan R. Northam
Long-term statistical analysis shows the Dow Jones Industrial Average is currently working through its topping stage.
Position: N/A
Alan R. Northam
Alan Northam lives in the Dallas, Texas area and as an electronic engineer gave him an analytical mind from which he has developed a thorough knowledge of stock market technical analysis. His abilities to analyze the future direction of the stock market has allowed him to successfully trade of his own portfolio over the last 30 years. Mr. Northam is now retired and trading the stock market full time. You can reach him at inquiry@tradersclassroom.com or by visiting his website at http://www.tradersclassroom.com. You can also follow him on Twitter @TradersClassrm.
PRINT THIS ARTICLE
STATISTICS
Dow Jones Industrials Topping Stage
04/16/13 03:36:52 PMby Alan R. Northam
Long-term statistical analysis shows the Dow Jones Industrial Average is currently working through its topping stage.
Position: N/A
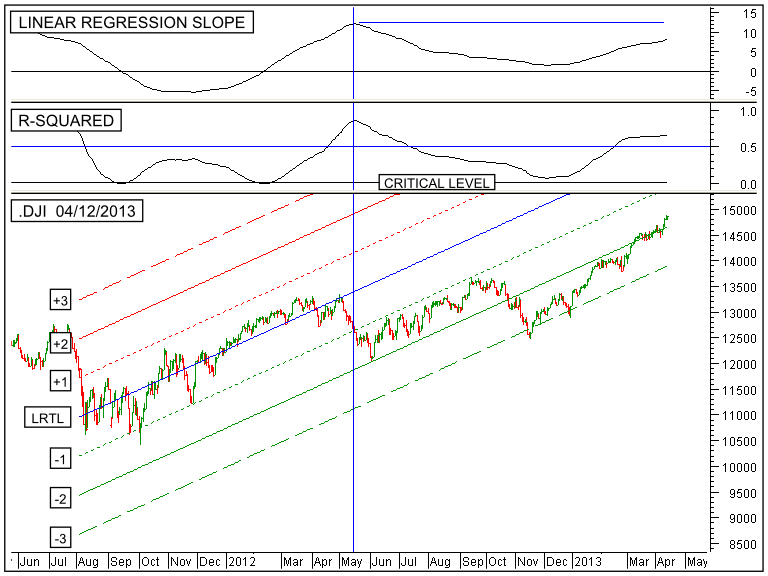
| The lower panel of Figure 1 shows the daily price bars of the Dow Jones Industrial Average (DJIA). This figure also shows the 200-day linear regression trend line (blue line) along with the upper 1 sigma channel line (red dotted line), the upper 2 sigma channel line (solid red line), the lower 1 sigma channel (green dotted line), the lower 2 sigma channel line (solid green line), and the lower 3 sigma channel line (dashed green line). The red channel lines represent resistance lines and the green channel lines represent support. |
|
| FIGURE 1: DJIA, DAILY. This chart shows the daily price chart of the Dow Jones Industrial Average (DJIA) in the lower panel along with its 200-day linear regression trend line and its associate channel lines. The top panel shows the linear regression slope indicator followed by the R-squared indicator in the next lower panel. |
| Graphic provided by: MetaStock. |
| |
| The linear regression trend line and its associated upper and lower standard deviation channel lines are drawn on the chart, to the left of the vertical blue line, from early August 2011-mid May 2012 covering a period of 200 trading sessions. From mid May 2012 onward, to the right of the vertical blue line, the linear regression trend Line and its associated channel lines have been extended to show the projected future path of the upward trend. Notice that from August 2011-May 2012 the closing price of the DJIA traded between the upper and lower 1 sigma channel lines indicating a strong long-term upward trend (From statistics the closer the data is to the linear regression trend Line the stronger the trend). Notice, also, that in mid May 2012 the closing price fell below the -1 sigma channel line trading between the -1 and -2 sigma channel lines until late October 2012. This is a sign of weakness as the closing price did not trade back up to the linear regression trend line (the upward sloping blue line). In late October 2012 the closing price moved further away from the linear regression trend line by moving below the -2 sigma channel line as the trend continued to weaken. |
| Another tool to measure the long term upward trend is the linear regression slope indicator in the top panel of Figure 1. This indicator provides several pieces of useful information about the trend. First, when this indicator moves above its zero line, it indicates a long term upward trend, and when it moves below its zero line, it indicates a long term downward trend. Second, when this indicator is moving upward, it indicates a period of price acceleration, and when it is moving in a downward direction, it indicates a period of price deceleration. Notice that from late November 2011-mid May 2012 the linear regression slope indicator moved in an upward direction, indicating a period of price acceleration. This is the period in which the index is moving upward at a faster rate compared to its value 200 trading sessions ago; this is the main period of the trend where price moves the farthest in the shortest period of time. (Note: A trend is divided into three periods: the basing period, the trending period, and the topping period. The basing period for the current trend lasted between early September 2012 and late November 2012, the main trending period lasted from late November 2012 to mid May 2012, and the topping stage has been underway since mid May 2012.) From mid May 2012-early December 2012 the linear regression slope indicator moved in a downward direction indicating a period of price deceleration. Price deceleration is a period in which price continues to move higher but at a slower rate compared to its price 200 trading sessions ago. Price deceleration marks the last stage, or the topping stage, of the upward trend. Sometimes, during this final stage of a trend, price will start to re-accelerate but usually does so at a slower rate than the price acceleration period of the main trend. This re-acceleration is not a requirement but does occur from time to time. This is depicted by the linear regression slope indicator moving upward but falling short of the peak made during the initial acceleration period (see horizontal blue line in the top window drawn from mid May 2012 onward). Notice that from early December 2012 onward the linear regression slope indicator turned back upward indicating the price has re-accelerated itself. Once the period of price deceleration, and occasionally a period of price re-acceleration, is complete the topping period is complete and the basing period for a new long term downward trend will begin. |
| The next lower panel shows the R-squared indicator and is a measure of confidence in the trend as well as a measure of its strength. In late February 2012 this indicator moved above its critical level to indicate a statistically significant long term upward trend that continues to this day. Whenever this indicator is above its critical level, it indicates that there is statistically a 95% confidence level that the trend will continue, as it has done. This indicator is also a measure of the trend's strength. The strength of the trend is determined by measuring what percentage of price movement over the last 200 trading sessions is considered to be trending or adding to the upward price movement. If this indicator read 0.8, for example, it would be indicating that 80% of the price movement over the last 200 trading sessions contributed to the price trend. By inference, it also says that 20% of the price movement was not contributing to the trend or simply random price movement. Notice that currently the R-squared indicator is reading 0.65 meaning that 65% of the price movement over the last 200 trading sessions contributed to the trend while 35% of the price movement did not. The higher the percentage of each session's price movement that adds to the trend, the stronger the trend. Notice that the trend is currently weaker than it was at the end of the period of price acceleration ending in May 2012. This tells us that the trend is weakening. |
| In conclusion, this statistical analysis shows that the long term trend of the DJIA has been in a period of price deceleration since May 2012, also known as the topping stage of a trend. This analysis also shows that the current trend has been weakening over this same period. Thus the long term upward trend of the DJIA is in its final stage and we should expect a downward trend reversal to occur once the topping stage is complete. |
Alan Northam lives in the Dallas, Texas area and as an electronic engineer gave him an analytical mind from which he has developed a thorough knowledge of stock market technical analysis. His abilities to analyze the future direction of the stock market has allowed him to successfully trade of his own portfolio over the last 30 years. Mr. Northam is now retired and trading the stock market full time. You can reach him at inquiry@tradersclassroom.com or by visiting his website at http://www.tradersclassroom.com. You can also follow him on Twitter @TradersClassrm.
| Garland, Tx | |
| Website: | www.tradersclassroom.com |
| E-mail address: | inquiry@tradersclassroom.com |
Click here for more information about our publications!
Comments

Request Information From Our Sponsors
- StockCharts.com, Inc.
- Candle Patterns
- Candlestick Charting Explained
- Intermarket Technical Analysis
- John Murphy on Chart Analysis
- John Murphy's Chart Pattern Recognition
- John Murphy's Market Message
- MurphyExplainsMarketAnalysis-Intermarket Analysis
- MurphyExplainsMarketAnalysis-Visual Analysis
- StockCharts.com
- Technical Analysis of the Financial Markets
- The Visual Investor
- VectorVest, Inc.
- Executive Premier Workshop
- One-Day Options Course
- OptionsPro
- Retirement Income Workshop
- Sure-Fire Trading Systems (VectorVest, Inc.)
- Trading as a Business Workshop
- VectorVest 7 EOD
- VectorVest 7 RealTime/IntraDay
- VectorVest AutoTester
- VectorVest Educational Services
- VectorVest OnLine
- VectorVest Options Analyzer
- VectorVest ProGraphics v6.0
- VectorVest ProTrader 7
- VectorVest RealTime Derby Tool
- VectorVest Simulator
- VectorVest Variator
- VectorVest Watchdog