

HOT TOPICS LIST
- MACD
- Fibonacci
- RSI
- Gann
- ADXR
- Stochastics
- Volume
- Triangles
- Futures
- Cycles
- Volatility
- ZIGZAG
- MESA
- Retracement
- Aroon
INDICATORS LIST
LIST OF TOPICS
PRINT THIS ARTICLE
by Matt Blackman
Traders have a habit of discounting fundamental data. But here are two that should not be ignored.
Position: N/A
Matt Blackman
Matt Blackman is a full-time technical and financial writer and trader. He produces corporate and financial newsletters, and assists clients in getting published in the mainstream media. He is the host of TradeSystemGuru.com. Matt has earned the Chartered Market Technician (CMT) designation. Find out what stocks and futures Matt is watching on Twitter at www.twitter.com/RatioTrade
PRINT THIS ARTICLE
DIVERGENCE INDEX
Two Fundamental Metrics That Matter
04/15/13 03:43:02 PMby Matt Blackman
Traders have a habit of discounting fundamental data. But here are two that should not be ignored.
Position: N/A
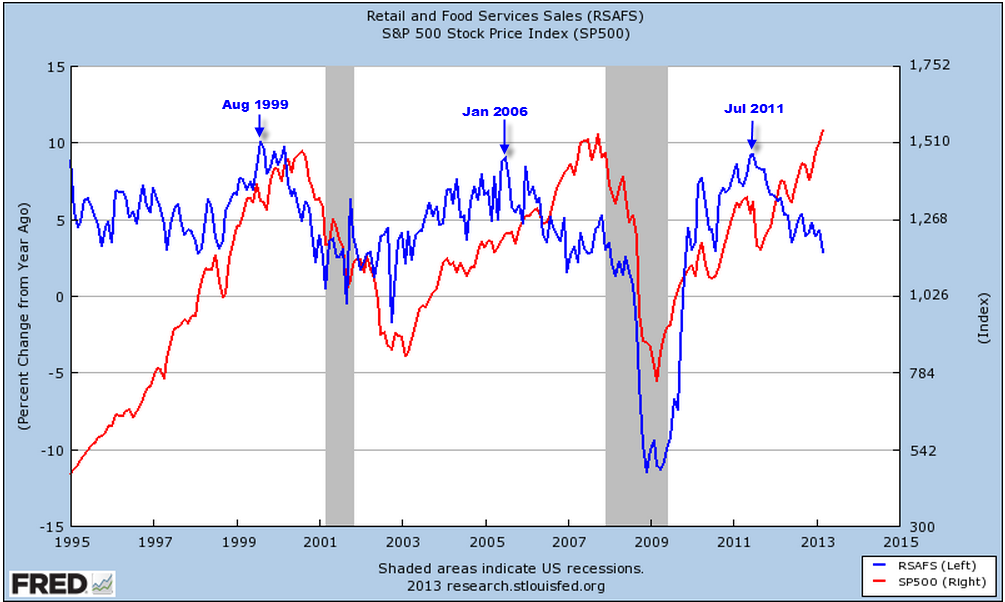
| As technicians we traders have a habit of ignoring fundamental data. Yes, it usually lags prices and yes, by the time earnings show disturbing declines, stock prices have often already fallen. But let's not throw the baby out with the bathwater. A recent article on a financial website discussed that retail sales were falling, which should concern the bulls. Unfortunately, the embedded chart that included the S&P500 only went back to 2009. Further research was necessary. What I found on the St. Louis Federal Reserve (FRED) site confirmed that there was a historic, albeit volatile, relationship between the two (Figure 1). |
|
| Figure 1: Retail and Food Sales (RSAFS) vs. S&P 500. |
| Graphic provided by: St. Louis Federal Reserve. |
| |
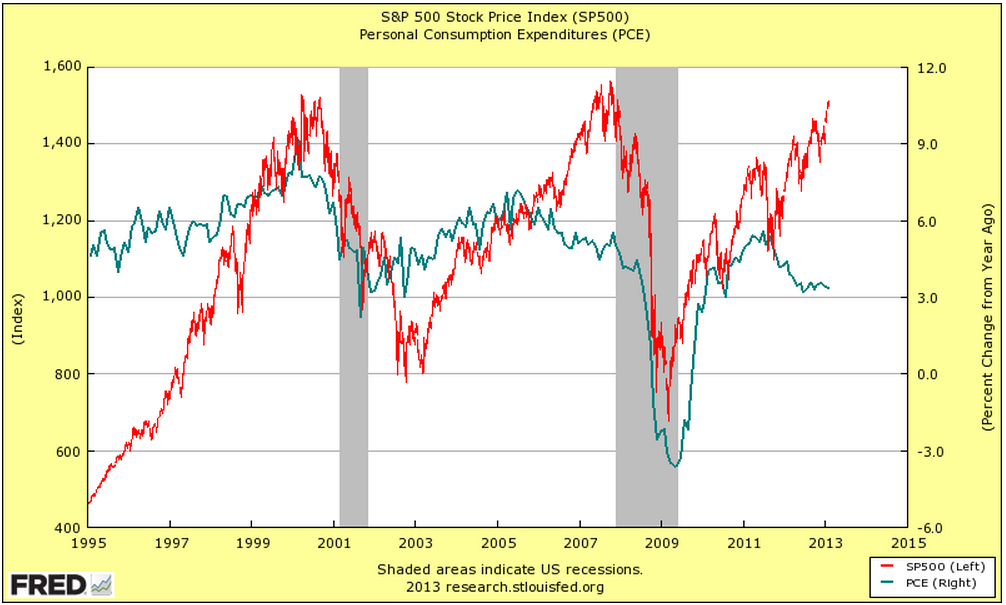
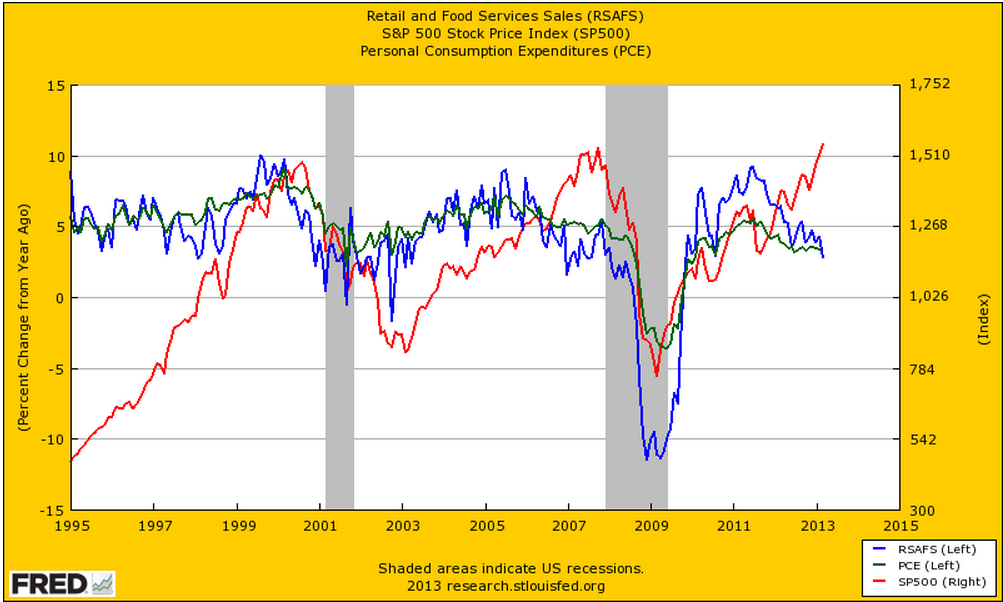
| As we see in Figure 1, there is a visible correlation between retail and food sales (RSAFS) and stocks over the last two decades with a growing lag. In 1999, RSAFS turned down approximately one year ahead of stocks. In 2006 RSAFS peaked about 19 months ahead of the SPX. However, the next peak in RSAFS came in July 2011 but by April 2013, 21 months later, stocks were still going strong. We see a similar relationship between Personal Consumption Expenditures (PCE), a measure of the cost of consumer goods and services used by individuals, and stocks. This is further confirmation of the relationship in Figure 1 although RSASF tends to lead stocks by a wider margin (Figure 3) than PCE. |
|
| Figure 2: Personal Consumption Expenditures (PCE) vs. S&P 500. |
| Graphic provided by: St. Louis Federal Reserve. |
| |
| Although retail sales and PCE appear to be pointing to weaker stock prices ahead, when will stocks respond? One possible answer to that question requires some background. |
|
| Figure 3: RSAFS vs. PCE vs. S&P 500. |
| Graphic provided by: St. Louis Federal Reserve. |
| |
| Background: Today Quantitative Easing (QE) has become the new way of managing economies but it wasn't always this way. It has become clear that the endless streams of stimulus since 2008 have not had anywhere near the desired effect on the economy but the same can't be said for stocks. The Federal Reserve's first big stimulus kick came in February 2007 when its balance sheet temporarily jumped more than 150%. The next 150% plus Fed kick came in July as stocks began to struggle. This time the effect was more muted on stocks but it would take the collapses of Lehman and Bear Stearns in 2008 to really get the pumps going. In late 2008 and into 2009, all stops were pulled out and at some points, the Federal Reserve balance sheet jumped by more than 20,000% from the year earlier. By March 2009 these efforts began to pay off -- at least for stocks. By 2010, the Fed had stopped aggressively (and openly) expanding their balance sheet instead adopting a new strategy of buying (and selling) Treasuries in Operation Twist to help keep the lid on interest rates. |
| Not only have QE programs changed markets forever; it is possible that QE may have also extended the lag between retail sales, PCE, and stocks. But unless this relationship has disappeared altogether, as those from the popular "this time is different" camp would have you believe, it is only a matter of time before stocks follow retail sales. For more Traders.com Advantage articles on possible stock topping signs please see "Negative Divergences In Stocks - Another Warning Sign?", "Two Charts That Matter" and "More Stock Market Topping Signs". |
Matt Blackman is a full-time technical and financial writer and trader. He produces corporate and financial newsletters, and assists clients in getting published in the mainstream media. He is the host of TradeSystemGuru.com. Matt has earned the Chartered Market Technician (CMT) designation. Find out what stocks and futures Matt is watching on Twitter at www.twitter.com/RatioTrade
| Company: | TradeSystemGuru.com |
| Address: | Box 2589 |
| Garibaldi Highlands, BC Canada | |
| Phone # for sales: | 604-898-9069 |
| Fax: | 604-898-9069 |
| Website: | www.tradesystemguru.com |
| E-mail address: | indextradermb@gmail.com |
Traders' Resource Links | |
| TradeSystemGuru.com has not added any product or service information to TRADERS' RESOURCE. | |
Click here for more information about our publications!
Comments

Request Information From Our Sponsors
- StockCharts.com, Inc.
- Candle Patterns
- Candlestick Charting Explained
- Intermarket Technical Analysis
- John Murphy on Chart Analysis
- John Murphy's Chart Pattern Recognition
- John Murphy's Market Message
- MurphyExplainsMarketAnalysis-Intermarket Analysis
- MurphyExplainsMarketAnalysis-Visual Analysis
- StockCharts.com
- Technical Analysis of the Financial Markets
- The Visual Investor
- VectorVest, Inc.
- Executive Premier Workshop
- One-Day Options Course
- OptionsPro
- Retirement Income Workshop
- Sure-Fire Trading Systems (VectorVest, Inc.)
- Trading as a Business Workshop
- VectorVest 7 EOD
- VectorVest 7 RealTime/IntraDay
- VectorVest AutoTester
- VectorVest Educational Services
- VectorVest OnLine
- VectorVest Options Analyzer
- VectorVest ProGraphics v6.0
- VectorVest ProTrader 7
- VectorVest RealTime Derby Tool
- VectorVest Simulator
- VectorVest Variator
- VectorVest Watchdog