

HOT TOPICS LIST
- MACD
- Fibonacci
- RSI
- Gann
- ADXR
- Stochastics
- Volume
- Triangles
- Futures
- Cycles
- Volatility
- ZIGZAG
- MESA
- Retracement
- Aroon
INDICATORS LIST
LIST OF TOPICS
PRINT THIS ARTICLE
by Donald W. Pendergast, Jr.
After being in consolidation/pullback mode for the past eight weeks, the stocks in the oils services industry group look ready to stage a long breakout.
Position: N/A
Donald W. Pendergast, Jr.
Freelance financial markets writer and online publisher of the Trendzetterz.com S&P 500 Weekly Forecast service.
PRINT THIS ARTICLE
RSI
OIH: New Long Trade Setup
04/12/13 03:48:54 PMby Donald W. Pendergast, Jr.
After being in consolidation/pullback mode for the past eight weeks, the stocks in the oils services industry group look ready to stage a long breakout.
Position: N/A
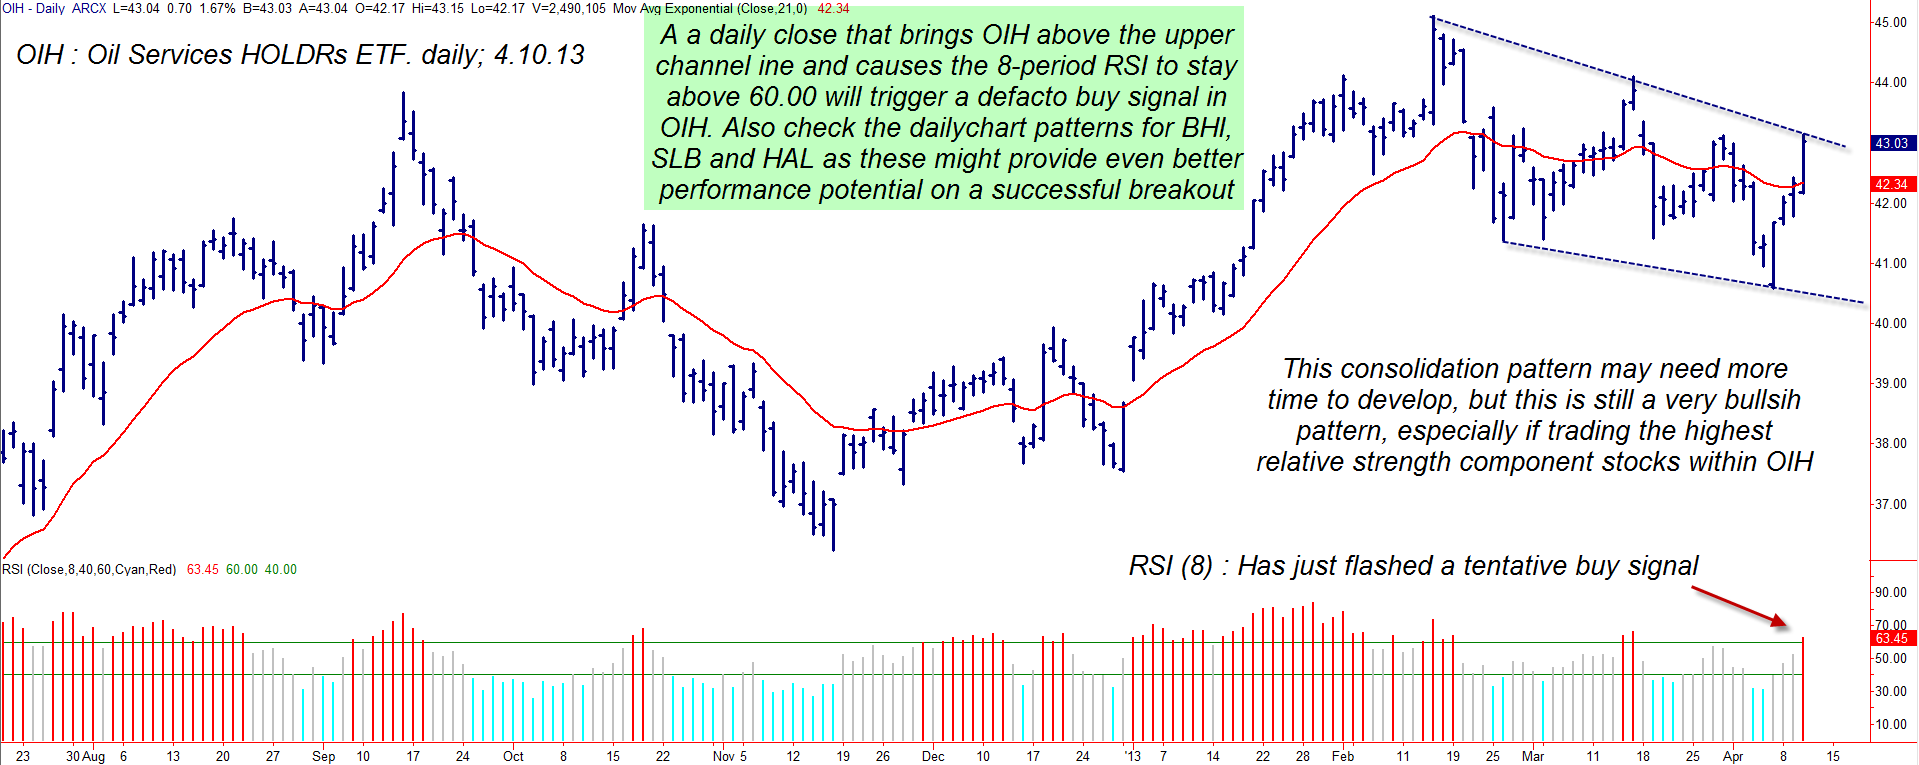
| As has been mentioned at various times in the past, stocks hailing from the oil services industry group are among the most volatile in the market; as such, they can sometimes make explosive swing and trending moves that savvy traders can learn to profit from on a regular basis. Here's a closer look at the very bullish appearing RSI breakout setup in the key ETF that tracks the movement of the stocks comprising the oil services industry group. |
|
| Figure 1: Trading a breakout from a large consolidation pattern can be tricky, but skilled traders should easily be able to figure out a way to extract profits from a continued rise in OIH. |
| Graphic provided by: TradeStation. |
| |
| Yesterday (April 9, 2013) it was the gold/silver stocks that made powerful upside breakouts; today, it's the stocks from the oil services group that are in the spotlight. Looking at OIH's daily graph, it's easy to see the very well formed consolidation that has helped this ETF make a proportional pullback against its previous uptrend; the eight-period RSI has leaped back above 60.00 and the money flow trend (not shown) is also suggesting that a breakout may have enough buying pressure beneath it to push OIH back above 45.12 (the February 2013 high in OIH). Now, there are a few dangers to buying a breakout of a major pattern like this, such as: 1. There are already tons of traders watching this pattern for a breakout, and you can be sure that insiders will be the first to act, possibly driving the price above the pattern, catching less informed latecomers off guard as they then quickly take profits, causing the laggards to get whipsawed. 2. Sometimes a large pattern like this (eight weeks old so far) needs more time before a valid, sustained breakout will commence, with several fake outs and shake outs along the way. Nevertheless, this still looks like a good buy setup, and here is a simple way to play it: |
|
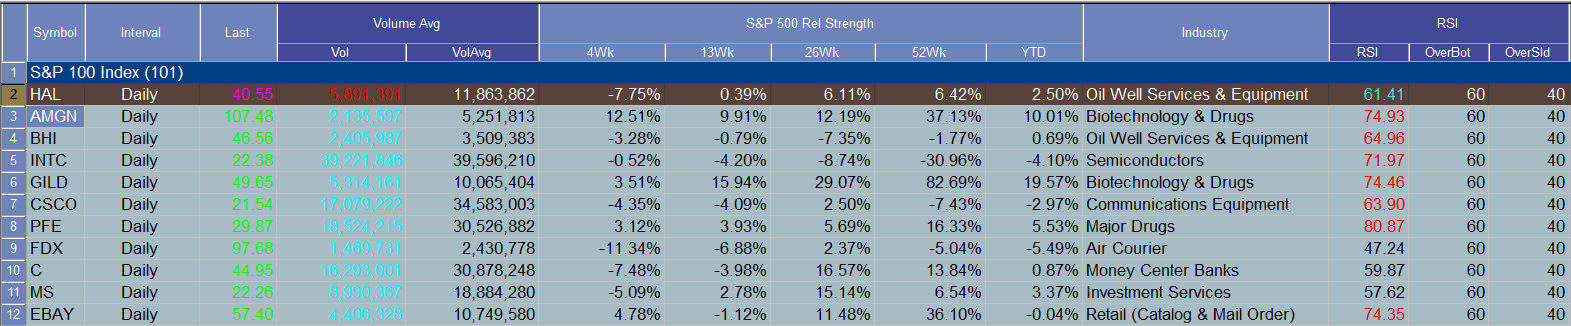
| Figure 2: Of all the S&P 100 index component stocks, Halliburton is offering one of the better long breakout setups among large cap stocks. |
| Graphic provided by: TradeStation. |
| Graphic provided by: TradeStation Radar Screen. |
| |
| Wait for OIH to push its 8-period RSI above 60.00 on a closing basis and then: 1. Place a buy stop order above the high of the daily price bar that pushed the RSI above 60.00. 2. If filled, immediately start running a two-bar trailing stop of the daily lows. Be sure and risk no more than 1% of your account value, as this is an above-average risk trade setup. 3. If the trade gains traction quickly look to sell half the position if it rises by 2 to 3% and then trail the rest of the position. Right now Halliburton (HAL) has excellent relative strength vs. OIH and the .SPX, so you may also want to trade HAL instead, in hopes of more potential gains. Skilled options traders might also want to investigate the possibility of selling a near term, out-of-the-money (otm) put option OIH, one that has a strike price below the current consolidation pattern's support level of 40.50; the May '13 OIH $40.00 put has a bid/ask spread of .05, has an open interest figure of 5,047 contracts and is selling for about .25 per contract. This put has about 5 weeks left until expiration and daily time decay will really begin to accelerate during the final 30 days of its lifespan, offering put sellers a bit of a market edge that stock traders simply don't have. You might want to wait for a pullback towards the red 21-day simple moving average (SMA) before attempting this put sale, and only consider this trade if you are willing to cut your losses quickly (if the put rises in value by 80 to 100%). Trade wisely until we meet here again. |
Freelance financial markets writer and online publisher of the Trendzetterz.com S&P 500 Weekly Forecast service.
| Title: | Market consultant and writer |
| Company: | Trendzetterz |
| Address: | 81 Hickory Hollow Drive |
| Crossville, TN 38555 | |
| Phone # for sales: | 904-303-4814 |
| Website: | trendzetterz.com |
| E-mail address: | support@trendzetterz.com |
Traders' Resource Links | |
| Trendzetterz has not added any product or service information to TRADERS' RESOURCE. | |
Click here for more information about our publications!
PRINT THIS ARTICLE

Request Information From Our Sponsors
- StockCharts.com, Inc.
- Candle Patterns
- Candlestick Charting Explained
- Intermarket Technical Analysis
- John Murphy on Chart Analysis
- John Murphy's Chart Pattern Recognition
- John Murphy's Market Message
- MurphyExplainsMarketAnalysis-Intermarket Analysis
- MurphyExplainsMarketAnalysis-Visual Analysis
- StockCharts.com
- Technical Analysis of the Financial Markets
- The Visual Investor
- VectorVest, Inc.
- Executive Premier Workshop
- One-Day Options Course
- OptionsPro
- Retirement Income Workshop
- Sure-Fire Trading Systems (VectorVest, Inc.)
- Trading as a Business Workshop
- VectorVest 7 EOD
- VectorVest 7 RealTime/IntraDay
- VectorVest AutoTester
- VectorVest Educational Services
- VectorVest OnLine
- VectorVest Options Analyzer
- VectorVest ProGraphics v6.0
- VectorVest ProTrader 7
- VectorVest RealTime Derby Tool
- VectorVest Simulator
- VectorVest Variator
- VectorVest Watchdog