HOT TOPICS LIST
- MACD
- Fibonacci
- RSI
- Gann
- ADXR
- Stochastics
- Volume
- Triangles
- Futures
- Cycles
- Volatility
- ZIGZAG
- MESA
- Retracement
- Aroon
INDICATORS LIST
LIST OF TOPICS
PRINT THIS ARTICLE
by Koos van der Merwe
The Dow Transportation Index is said to be a leader.
Position: Buy
Koos van der Merwe
Has been a technical analyst since 1969, and has worked as a futures and options trader with First Financial Futures in Johannesburg, South Africa.
PRINT THIS ARTICLE
ELLIOTT WAVE
That Contradiction
04/11/13 04:55:18 PMby Koos van der Merwe
The Dow Transportation Index is said to be a leader.
Position: Buy
| The Dow Transportation Index is a running average of the stock prices of twenty transportation corporations, with each stock's price weighted to adjust for stock splits and other factors. Ever since it was first introduced by Charles Dow, the Industrial Average (DJIA) has been used by various investors in an attempt to predict movements in the stock market. One of these concepts is called the Dow Theory. A rise in the Dow Jones Industrial Average must be confirmed by the Dow Jones Transportation Average for the rise in the market to be sustainable. This theory is based on the simple relationship that exists between "industrials" that make products and the "transports" that ship the product. When the industrials and transports diverge, a warning flag rises for stock market investors. Looking at the chart of the DJIA and the transports, we see a divergence possibly occurring. |

|
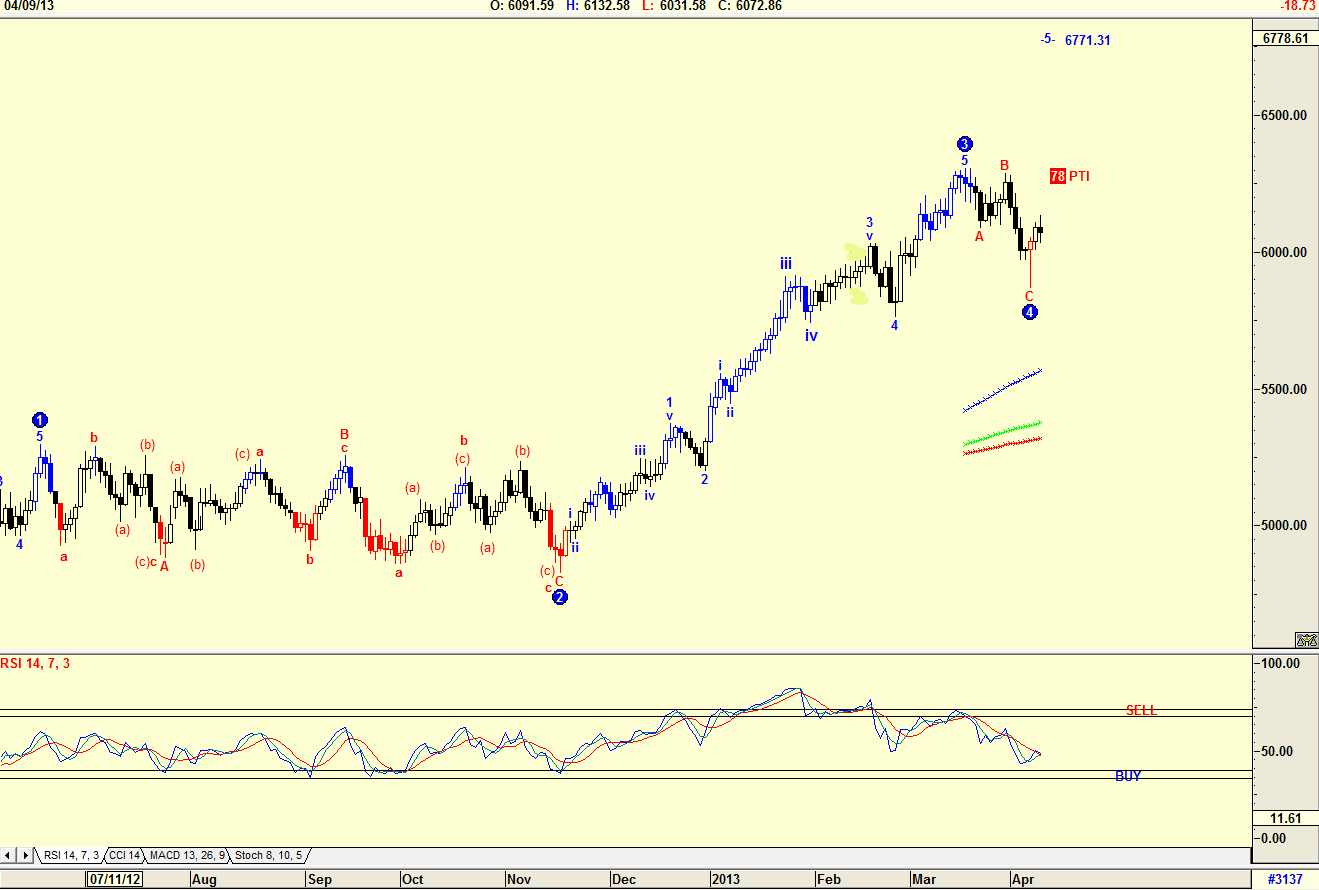
| Figure 1. Dow Transportation Index |
| Graphic provided by: AdvancedGET. |
| |
| Figure 1 is a daily chart of the Dow Transportation Index with an Elliott Wave count. The count suggests that the index has completed WAVE 4 and is now in a WAVE 5 with a target of 6771.31. The Probability Index (PTI) is 78, suggesting that the possibility of this rise is strong. The RSI indicator has, however, not reached oversold levels casting some doubt. Nevertheless, the Elliott Wave count does look convincing. |

|
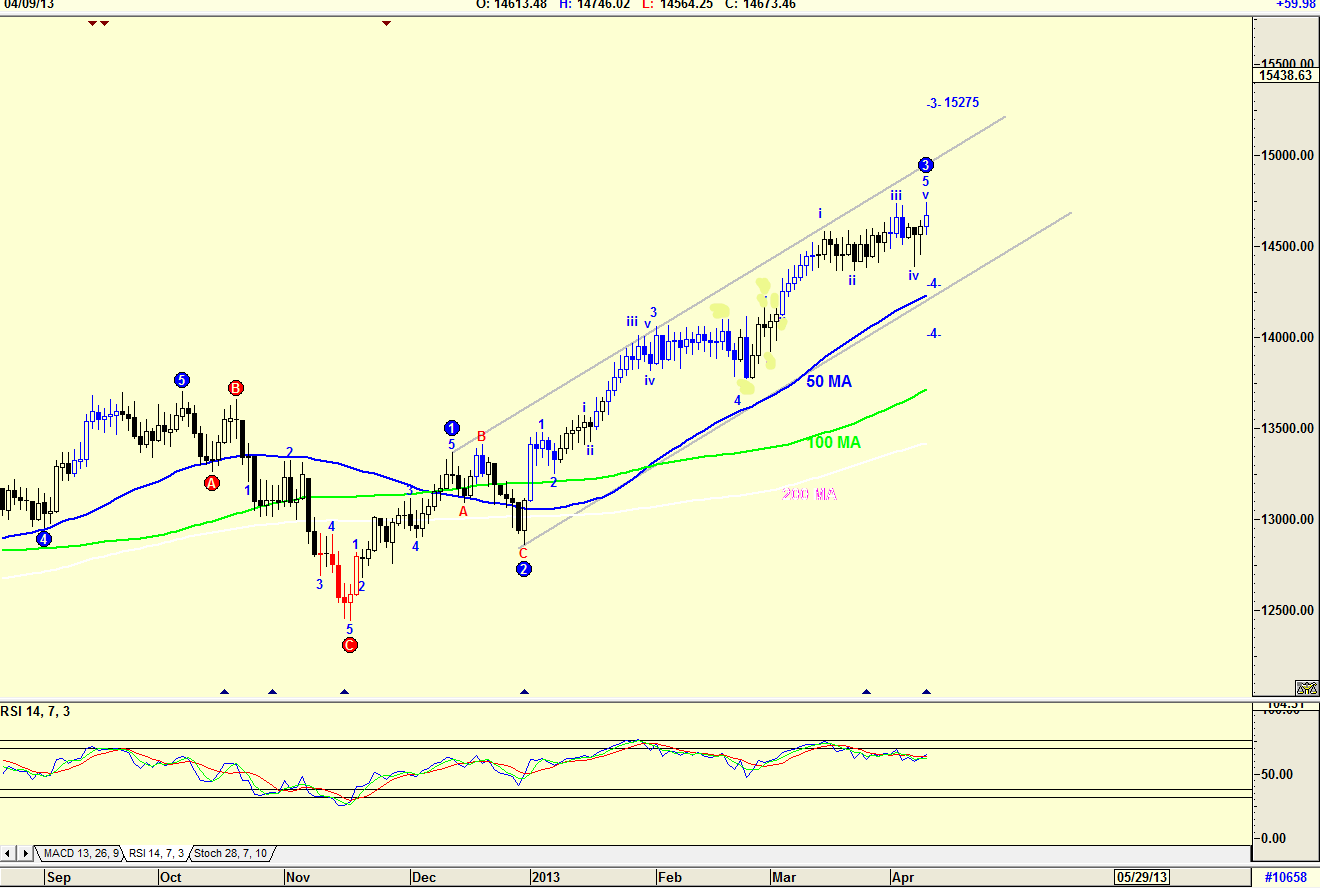
| Figure 2. Dow Jones Industrial Average |
| Graphic provided by: AdvancedGET. |
| |
| The chart in Figure 2 is of the Dow Jones Industrial Average (DJIA). The Elliott Wave count suggests that the DJIA is in a WAVE 3 up and that it should correct into a WAVE 4 down. The RSI indicator is still trending down, suggesting that this is possible. The chart is, however, also suggesting that the Dow could rise to 15275 before the correction occurs. This would agree with the Dow Transportation Index projection. We know that a correction is on the cards. The mantra, "Sell in May" is on our minds, and the performance of the Dow Transportation Index is suggesting that this may be the case. With Wave 2 of the Dow being a relatively simple correction, Wave 4 could be a complex correction, and last a few months, which would tie in well with what the charts are telling us. Invest in the market, yes, but do keep an eye on the indexes and keep your stops close to your chest. |
Has been a technical analyst since 1969, and has worked as a futures and options trader with First Financial Futures in Johannesburg, South Africa.
| Address: | 3256 West 24th Ave |
| Vancouver, BC | |
| Phone # for sales: | 6042634214 |
| E-mail address: | petroosp@gmail.com |
Click here for more information about our publications!
Comments
Date: 04/17/13Rank: 5Comment:

Request Information From Our Sponsors
- StockCharts.com, Inc.
- Candle Patterns
- Candlestick Charting Explained
- Intermarket Technical Analysis
- John Murphy on Chart Analysis
- John Murphy's Chart Pattern Recognition
- John Murphy's Market Message
- MurphyExplainsMarketAnalysis-Intermarket Analysis
- MurphyExplainsMarketAnalysis-Visual Analysis
- StockCharts.com
- Technical Analysis of the Financial Markets
- The Visual Investor
- VectorVest, Inc.
- Executive Premier Workshop
- One-Day Options Course
- OptionsPro
- Retirement Income Workshop
- Sure-Fire Trading Systems (VectorVest, Inc.)
- Trading as a Business Workshop
- VectorVest 7 EOD
- VectorVest 7 RealTime/IntraDay
- VectorVest AutoTester
- VectorVest Educational Services
- VectorVest OnLine
- VectorVest Options Analyzer
- VectorVest ProGraphics v6.0
- VectorVest ProTrader 7
- VectorVest RealTime Derby Tool
- VectorVest Simulator
- VectorVest Variator
- VectorVest Watchdog
