HOT TOPICS LIST
- MACD
- Fibonacci
- RSI
- Gann
- ADXR
- Stochastics
- Volume
- Triangles
- Futures
- Cycles
- Volatility
- ZIGZAG
- MESA
- Retracement
- Aroon
INDICATORS LIST
LIST OF TOPICS
PRINT THIS ARTICLE
by Andrew Hetherington
The stock price for SERENA Software broke below its triangle formation recently. A quick look at volume can help you judge the strength of the triangle formation.
Position: N/A
Andrew Hetherington
Classic Dow Theorist who trades as a pure technician, using pattern recognition.
PRINT THIS ARTICLE
DESCENDING TRIANGLES
A Perfect Triangle for SERENA Software
08/15/02 11:58:30 AMby Andrew Hetherington
The stock price for SERENA Software broke below its triangle formation recently. A quick look at volume can help you judge the strength of the triangle formation.
Position: N/A
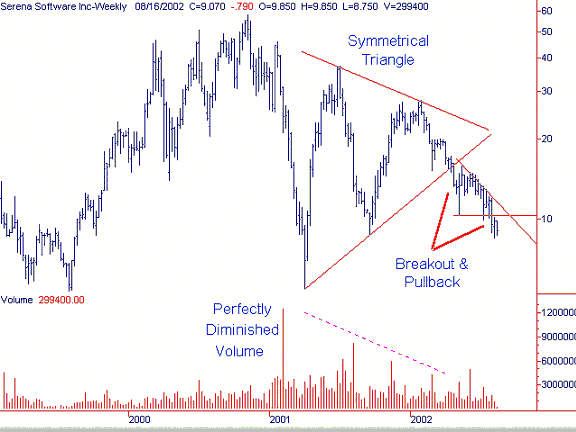
 Figure 1: Weekly chart for SRNA. It's been some time since I've seen a perfect triangle and here it is! SERENA Software (SRNA) has the perfectly diminished volume that I so often pine for. The tops and bottoms are clear and crisp. This perfect one-year symmetrical triangle on the weekly chart illustrates the power that will push this equity below $5.00. The volume on the larger symmetrical triangle diminishes slowly throughout the pattern. It then consolidates for three months before the inevitable drop. |

|
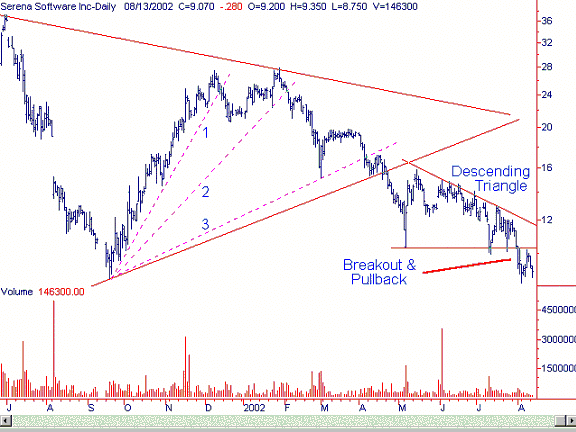
| Figure 2: Daily chart for SRNA |
| Graphic provided by: SuperCharts. |
| |
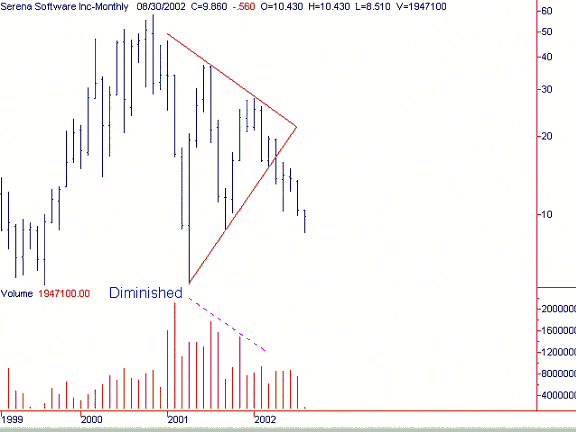
This consolidation can best be seen on the daily chart. A 3-month descending triangle forms with a nice opportunity to go short, once again off of the top line in the $12.00-$14.00 area. The third fan line was in the $18.00 area and gave the ideal opportunity to short this equity for the first time. The customary pullback to the fan line prior to the breakout of the large symmetrical triangle in the $17.00 area was the best shorting opportunity. This is the time when no one else has spotted the approaching downturn. The equity then drops hard from $18.00 to $10.35 in three weeks. Some may debate that this is slow, but I contend it is a safe style of play. After the hard drop you buy back the shorted shares and await another opportunity. That came in the $13.00 area two months later. Then there was another drop from the top line of the descending triangle from $12.95 down to $8.51 with the pullback up to the $10.00 line which took a few weeks once again. All in all there are at least three very good shorting opportunities on this chart in the past four months. There is much further downside in the cards and I'm very confident that it will go below $5.00 over time. Figure 3: Monthly chart for SRNA. |
Classic Dow Theorist who trades as a pure technician, using pattern recognition.
| Toronto, Canada |
Click here for more information about our publications!
Comments
Date: 08/16/02Rank: 1Comment:
Date: 08/17/02Rank: 5Comment:
Date: 08/17/02Rank: 2Comment: What went wrong with this call to go short

Request Information From Our Sponsors
- StockCharts.com, Inc.
- Candle Patterns
- Candlestick Charting Explained
- Intermarket Technical Analysis
- John Murphy on Chart Analysis
- John Murphy's Chart Pattern Recognition
- John Murphy's Market Message
- MurphyExplainsMarketAnalysis-Intermarket Analysis
- MurphyExplainsMarketAnalysis-Visual Analysis
- StockCharts.com
- Technical Analysis of the Financial Markets
- The Visual Investor
- VectorVest, Inc.
- Executive Premier Workshop
- One-Day Options Course
- OptionsPro
- Retirement Income Workshop
- Sure-Fire Trading Systems (VectorVest, Inc.)
- Trading as a Business Workshop
- VectorVest 7 EOD
- VectorVest 7 RealTime/IntraDay
- VectorVest AutoTester
- VectorVest Educational Services
- VectorVest OnLine
- VectorVest Options Analyzer
- VectorVest ProGraphics v6.0
- VectorVest ProTrader 7
- VectorVest RealTime Derby Tool
- VectorVest Simulator
- VectorVest Variator
- VectorVest Watchdog
