HOT TOPICS LIST
- MACD
- Fibonacci
- RSI
- Gann
- ADXR
- Stochastics
- Volume
- Triangles
- Futures
- Cycles
- Volatility
- ZIGZAG
- MESA
- Retracement
- Aroon
INDICATORS LIST
LIST OF TOPICS
PRINT THIS ARTICLE
by Donald W. Pendergast, Jr.
Shares of Qualcomm, Inc. may be on the verge of another trip south of their 50-day moving average.
Position: N/A
Donald W. Pendergast, Jr.
Freelance financial markets writer and online publisher of the Trendzetterz.com S&P 500 Weekly Forecast service.
PRINT THIS ARTICLE
TECHNICAL ANALYSIS
QCOM: Ready To Tank?
04/05/13 03:38:34 PMby Donald W. Pendergast, Jr.
Shares of Qualcomm, Inc. may be on the verge of another trip south of their 50-day moving average.
Position: N/A
| There's little doubt that the recent declines in the major US stock indexes appears to be of the 'major trend reversal' rather than the 'buy the dips' kind of correction and that savvy investors and traders need to be patient until the next low-risk buying opportunity arrives. For those skilled in short selling, however, the market is currently offering lots of opportunity — such as the one we'll take a look at in shares of Qualcomm, Inc. (QCOM). Here's a closer look. |

|
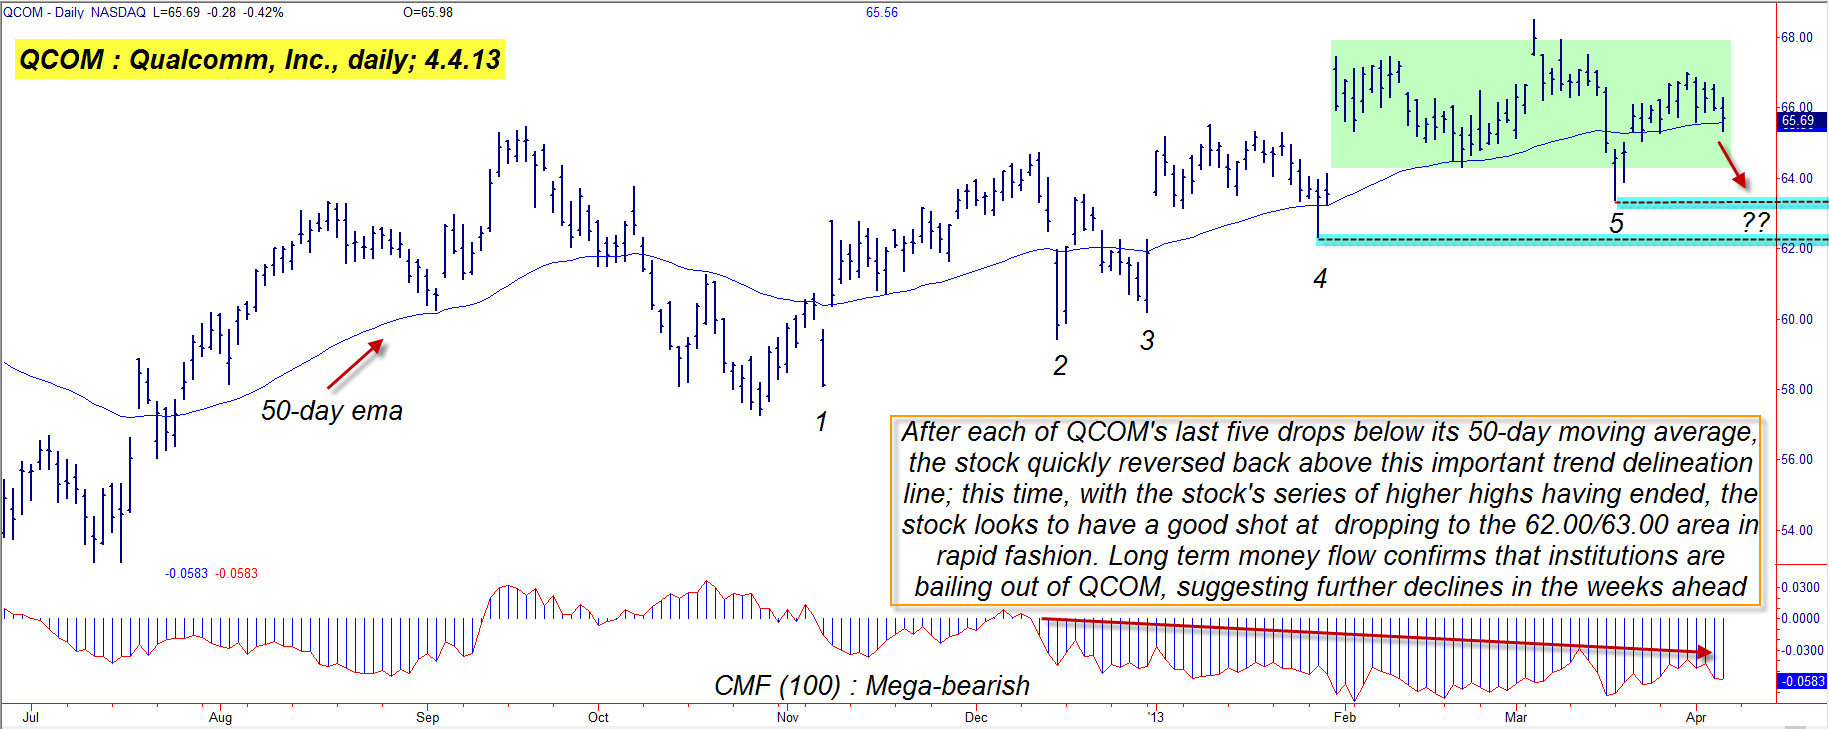
| Figure 1: While Qualcomm has been able to quickly bounce back above its 50-day moving average over the past five months, the stock's poor long-term money flow trend now makes it look likely that a larger scale breakdown may be on the way soon. |
| Graphic provided by: TradeStation. |
| |
| QCOM enjoyed a modest rally between the time of its major cycle low on July 17, 2012, and its recent swing high of March 5, 2013; the stock managed to put together a 29% rally in that period, one that had plenty of chaotic breakout/consolidation/gap action as it slowly worked its way higher. The entire rise from last July failed to reach the level of QCOM's previous major high of 68.83 (set on April 2, 2012), and as you look at the incredibly bearish long-term money flow histogram in this stock (based on the 100-day Chaikin Money flow indicator), you quickly realize that major institutional holders of this key tech sector issue appear to be scaling out of their holdings in QCOM. Further evidence of this is seen in QCOM's relative strength (vs. the .SPX) ranking; the stock has been under-performing the S&P 500 index over the past 4-, 13-, 26-, and 52-week periods and is also just above the critical eight-period RSI '40.00' sell line. The current RSI reading for QCOM is 41.78 and if/when it makes a daily close below 40.00 the odds are good that the stock will make tracks down toward one if not both of the next support levels — near 62.00 and 63.00, respectively. |

|
| Figure 2: QCOM has been under-performing the .SPX for much of 2012/2013. Lower prices are very likely for this stock heading into April/May 2013. |
| Graphic provided by: TradeStation. |
| Graphic provided by: TradeStation Radar Screen. |
| |
| Playing QCOM for potential profits on such an RSI breakdown might go something like this: 1. Place a sell stop market order to short QCOM five ticks (.05) below the low price of the daily bar that pushes the RSI below 40.00. 2. If filled on the trade, immediately start protecting the position with a two-bar trailing stop of the daily highs. 3. If QCOM quickly falls to 63.00, take profits on half of your position, continuing to trail the rest. 4. If 62.00 is reached shortly after hitting 63.00 consider closing out the rest of the trade for a profit and wait for another attractive trade setup. By no means risk more than 2% of your account value on this — or any other trade — and if market conditions are especially chaotic at the time of any particular trade entry, consider backing off your risk exposure even more, down to 1%. |
| As of this writing, both the Russell 2000 (.RUT) and S&P 400 MidCap indexes have found support at their simple 50-day moving averages (SMA), and things have quietened down a bit in the markets; however, don't let this fool you — all the major US stock indexes still appear to have a great deal of correcting to do before a relatively safe buying opportunity presents itself again. Trade wisely until we meet here again. |
Freelance financial markets writer and online publisher of the Trendzetterz.com S&P 500 Weekly Forecast service.
| Title: | Market consultant and writer |
| Company: | Trendzetterz |
| Address: | 81 Hickory Hollow Drive |
| Crossville, TN 38555 | |
| Phone # for sales: | 904-303-4814 |
| Website: | trendzetterz.com |
| E-mail address: | support@trendzetterz.com |
Traders' Resource Links | |
| Trendzetterz has not added any product or service information to TRADERS' RESOURCE. | |
Click here for more information about our publications!
PRINT THIS ARTICLE

|

Request Information From Our Sponsors
- StockCharts.com, Inc.
- Candle Patterns
- Candlestick Charting Explained
- Intermarket Technical Analysis
- John Murphy on Chart Analysis
- John Murphy's Chart Pattern Recognition
- John Murphy's Market Message
- MurphyExplainsMarketAnalysis-Intermarket Analysis
- MurphyExplainsMarketAnalysis-Visual Analysis
- StockCharts.com
- Technical Analysis of the Financial Markets
- The Visual Investor
- VectorVest, Inc.
- Executive Premier Workshop
- One-Day Options Course
- OptionsPro
- Retirement Income Workshop
- Sure-Fire Trading Systems (VectorVest, Inc.)
- Trading as a Business Workshop
- VectorVest 7 EOD
- VectorVest 7 RealTime/IntraDay
- VectorVest AutoTester
- VectorVest Educational Services
- VectorVest OnLine
- VectorVest Options Analyzer
- VectorVest ProGraphics v6.0
- VectorVest ProTrader 7
- VectorVest RealTime Derby Tool
- VectorVest Simulator
- VectorVest Variator
- VectorVest Watchdog
