HOT TOPICS LIST
- MACD
- Fibonacci
- RSI
- Gann
- ADXR
- Stochastics
- Volume
- Triangles
- Futures
- Cycles
- Volatility
- ZIGZAG
- MESA
- Retracement
- Aroon
INDICATORS LIST
LIST OF TOPICS
PRINT THIS ARTICLE
by Chaitali Mohile
The descending rally in Apache has entered a tricky trading range. Will the fall continue?
Position: N/A
Chaitali Mohile
Active trader in the Indian stock markets since 2003 and a full-time writer. Trading is largely based upon technical analysis.
PRINT THIS ARTICLE
TECHNICAL ANALYSIS
Apache In Narrowing Range
04/05/13 03:42:07 PMby Chaitali Mohile
The descending rally in Apache has entered a tricky trading range. Will the fall continue?
Position: N/A
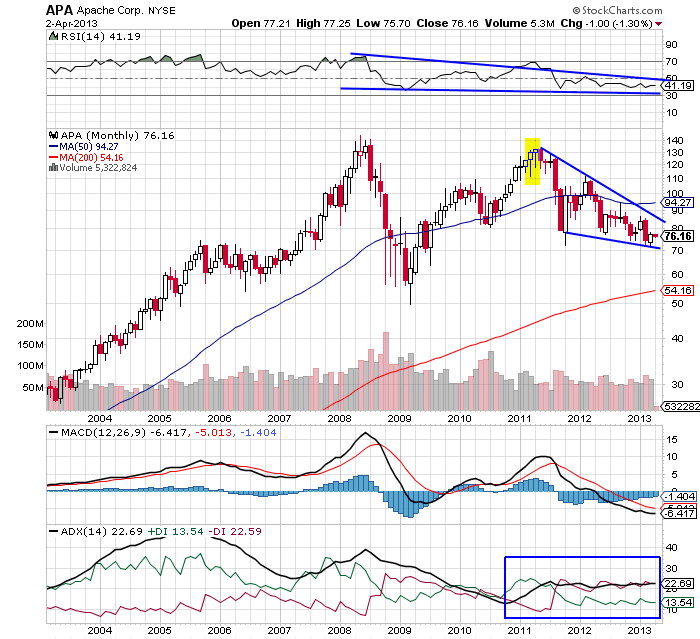
| Apache Corp (APA) formed lower highs in 2011. A hanging man, a bearish reversal candlestick pattern, formed at the top (yellow block in Figure 1). The single candlestick formation initiated a robust bearish rally. Gradually, APA plunged below the support of the 50-day moving average (MA). Although the stock tried to regain the lost MA support, increasing bearish pressure discouraged the move. Thereafter, APA continued its descending action, forming lower lows and lower highs. |
| The relative strength index (RSI) (14) in Figure 1 also formed lower highs under the resistance of 70 levels. The moving average convergence/divergence (MACD) (12,26,9) had a bearish crossover in positive territory, and a marginally developing uptrend turned downwards. The reversing indicators confirmed the hanging man candlestick pattern, thus, strengthening the bearish rally. |

|
| FIGURE 1: APA, MONTHLY. |
| Graphic provided by: StockCharts.com. |
| |
| Currently, APA has moved within a narrow trading range. For long-term traders and investors, trading in between the 10 point rally is risky. Short-term investors, however, can take advantage of this range-bound price movement. Since the downtrend indicated by the average directional index (ADX) (14) is developing steadily, the bearish force is likely to sustain. Therefore, traders should trade with low volumes. The negative MACD (12,26,9) in Figure 1 has plunged in negative territory. In addition, the RSI (14) has slipped below 50 levels. These conditions suggest that the stock would continue to form lower lows and highs. |
| The declining range is generally difficult for taking trading positions. But traders can stretch the two trendlines drawn in Figure 1 to identify the upper and lower ranges. The bearish rally of APA is moving closer to the various support areas below $70. As a result, the stock is likely to consolidate in this support zone, and could form a bottom. The stock has already descended almost 50% from the top; therefore, future price action could slow down. |
| To conclude, the bearish rally of APA is about to enter its support areas. Will this slow the speed of the fall? |
Active trader in the Indian stock markets since 2003 and a full-time writer. Trading is largely based upon technical analysis.
| Company: | Independent |
| Address: | C1/3 Parth Indraprasth Towers. Vastrapur |
| Ahmedabad, Guj 380015 | |
| E-mail address: | chaitalimohile@yahoo.co.in |
Traders' Resource Links | |
| Independent has not added any product or service information to TRADERS' RESOURCE. | |
Click here for more information about our publications!
PRINT THIS ARTICLE

|

Request Information From Our Sponsors
- StockCharts.com, Inc.
- Candle Patterns
- Candlestick Charting Explained
- Intermarket Technical Analysis
- John Murphy on Chart Analysis
- John Murphy's Chart Pattern Recognition
- John Murphy's Market Message
- MurphyExplainsMarketAnalysis-Intermarket Analysis
- MurphyExplainsMarketAnalysis-Visual Analysis
- StockCharts.com
- Technical Analysis of the Financial Markets
- The Visual Investor
- VectorVest, Inc.
- Executive Premier Workshop
- One-Day Options Course
- OptionsPro
- Retirement Income Workshop
- Sure-Fire Trading Systems (VectorVest, Inc.)
- Trading as a Business Workshop
- VectorVest 7 EOD
- VectorVest 7 RealTime/IntraDay
- VectorVest AutoTester
- VectorVest Educational Services
- VectorVest OnLine
- VectorVest Options Analyzer
- VectorVest ProGraphics v6.0
- VectorVest ProTrader 7
- VectorVest RealTime Derby Tool
- VectorVest Simulator
- VectorVest Variator
- VectorVest Watchdog
